LinkR EDU Usage Guide
-
Usage Flow
LinkR application usage flow is:
-
Create database connection for input and output of the process.
-
Insert tabular data from excel, csv, and tsv into the target table database.
-
Perform profiling to identify data patterns so that they can be cleaned from data sources.
-
Run standardization process to get more consistent data to improve deduplication accuracy.
-
Create deduplication configuration. Configuration information will be explained in chapter 2.
-
Run deduplication process from created configuration.
-
After deduplication process finished, summarize of the result can be seen in summary page.
-
In addition to the result, user can browse the detailed group data in the data steward page.
-
If the deduplication configuration already accepted and want to be processed periodically for incremental data (new and update), you need to untick the Initial setting in deduplication configuration.
-
-
Usage Guide
-
Open The Application
Run the LinkR Edu application by running the downloaded application. When run, a splash screen will appear as shown below, indicating that there is a loading process.

After finishing loading, the home page will open like the next chapter.
-
Home Page
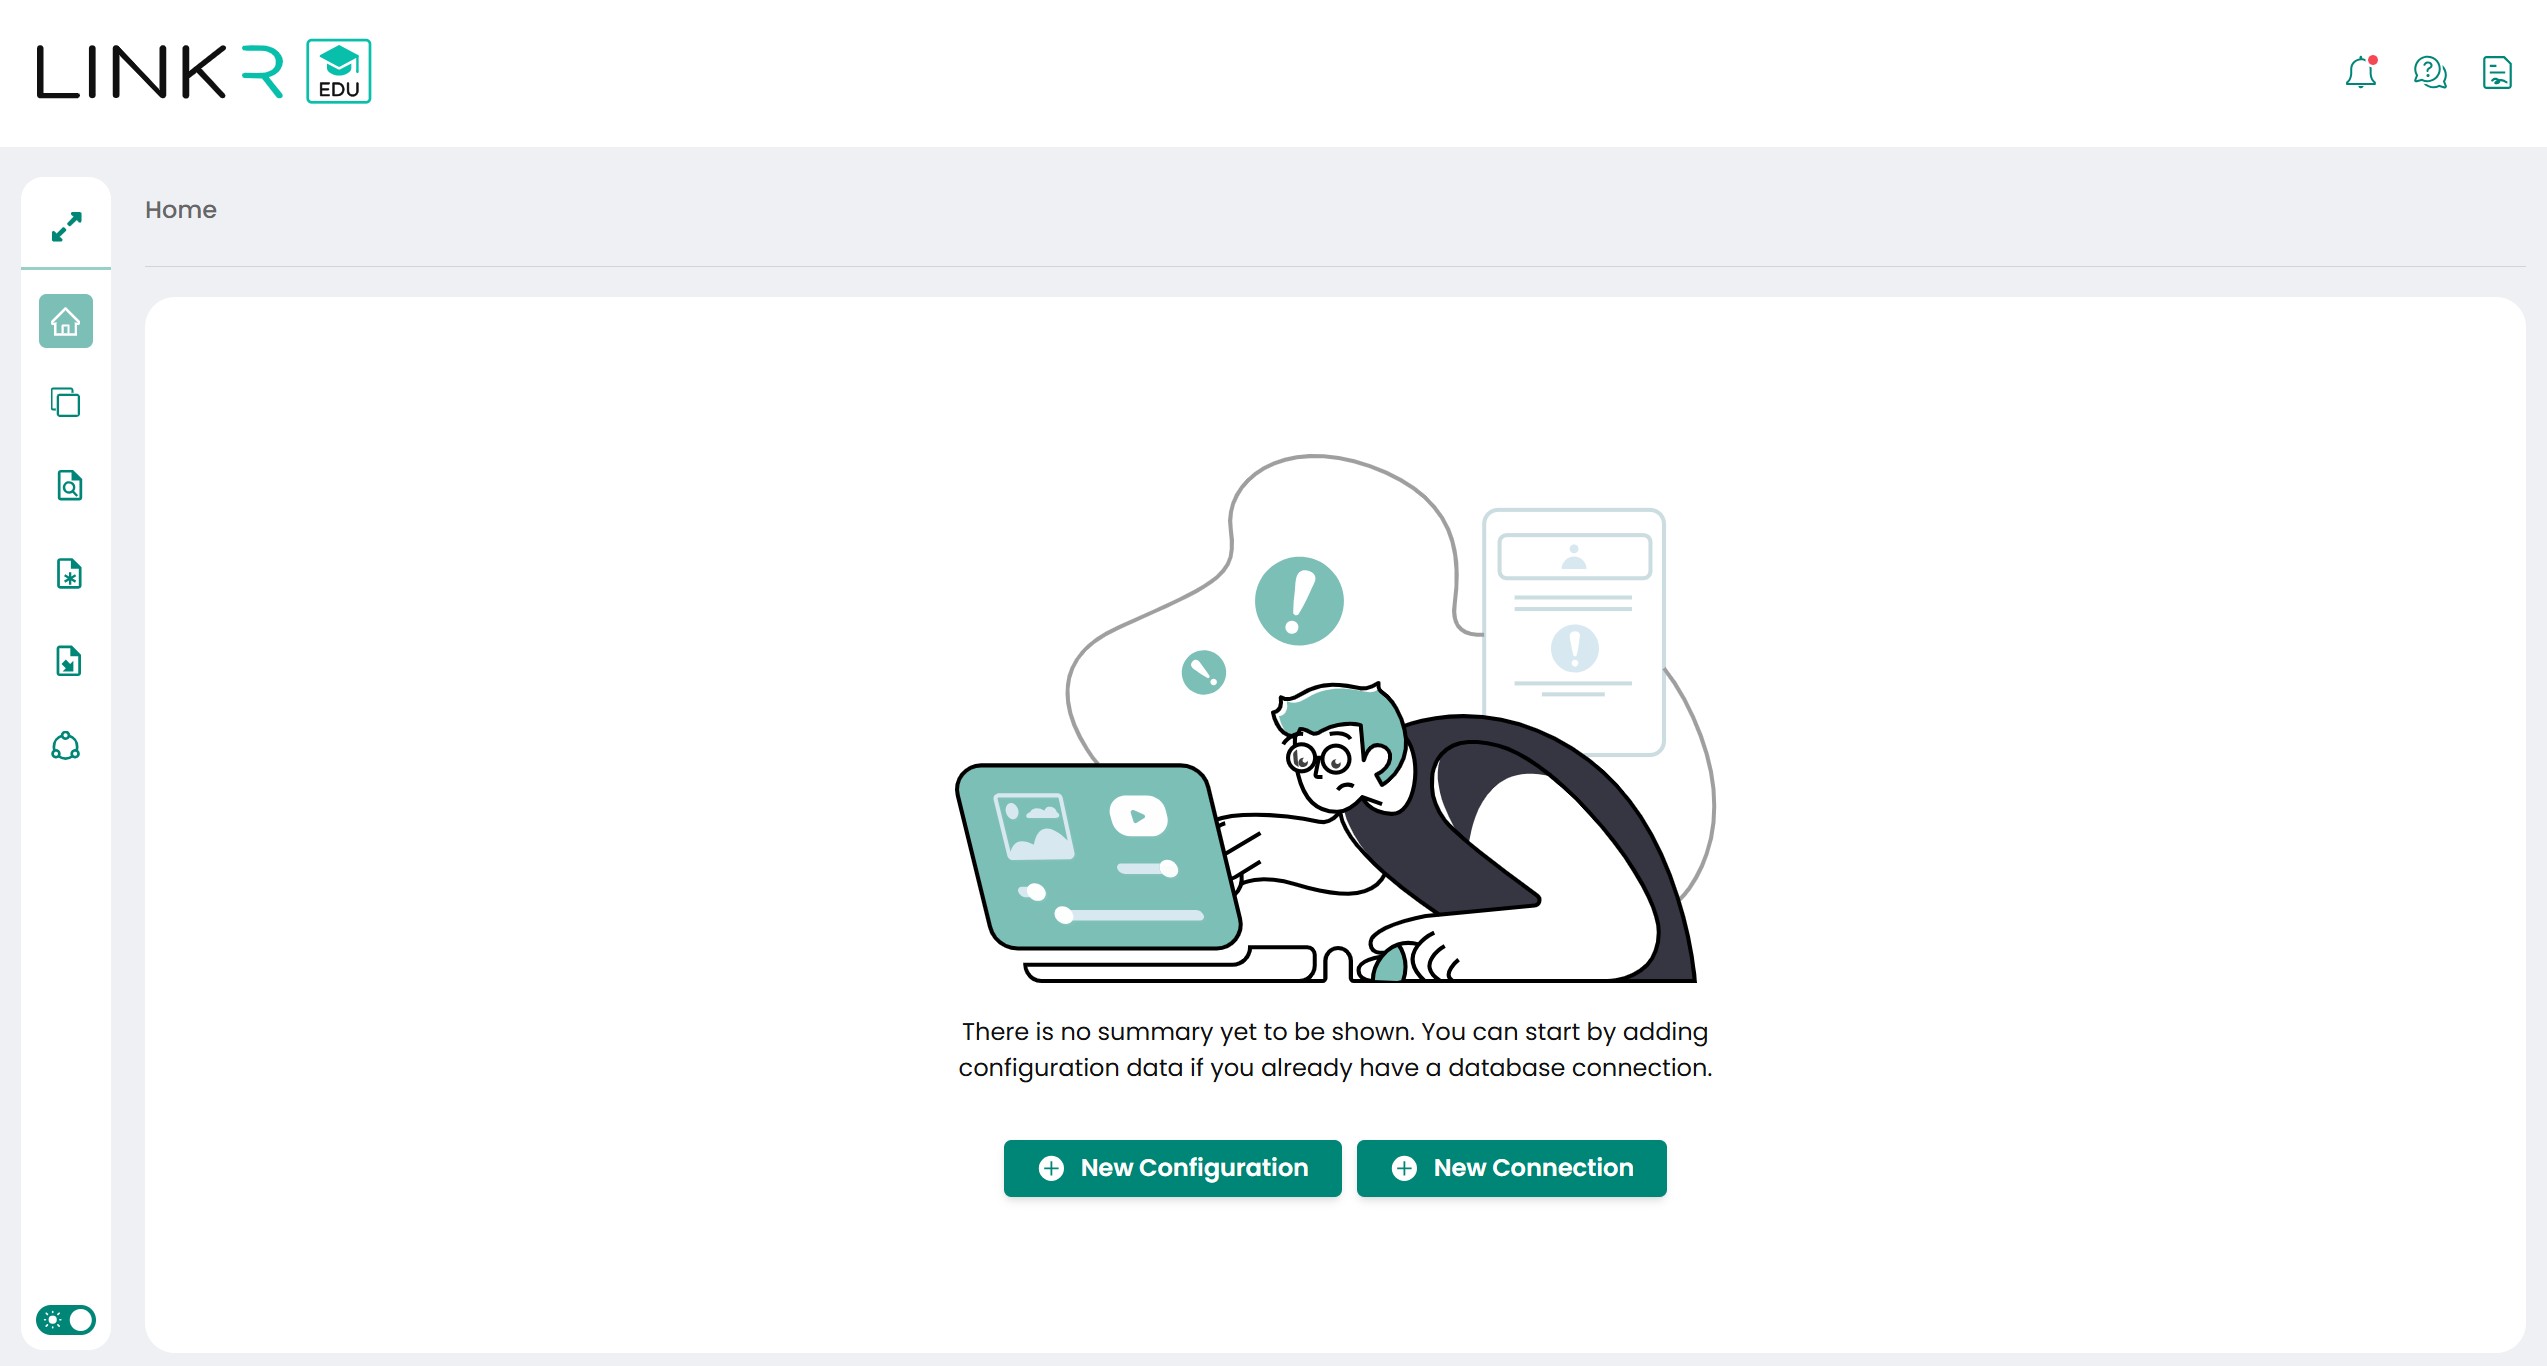
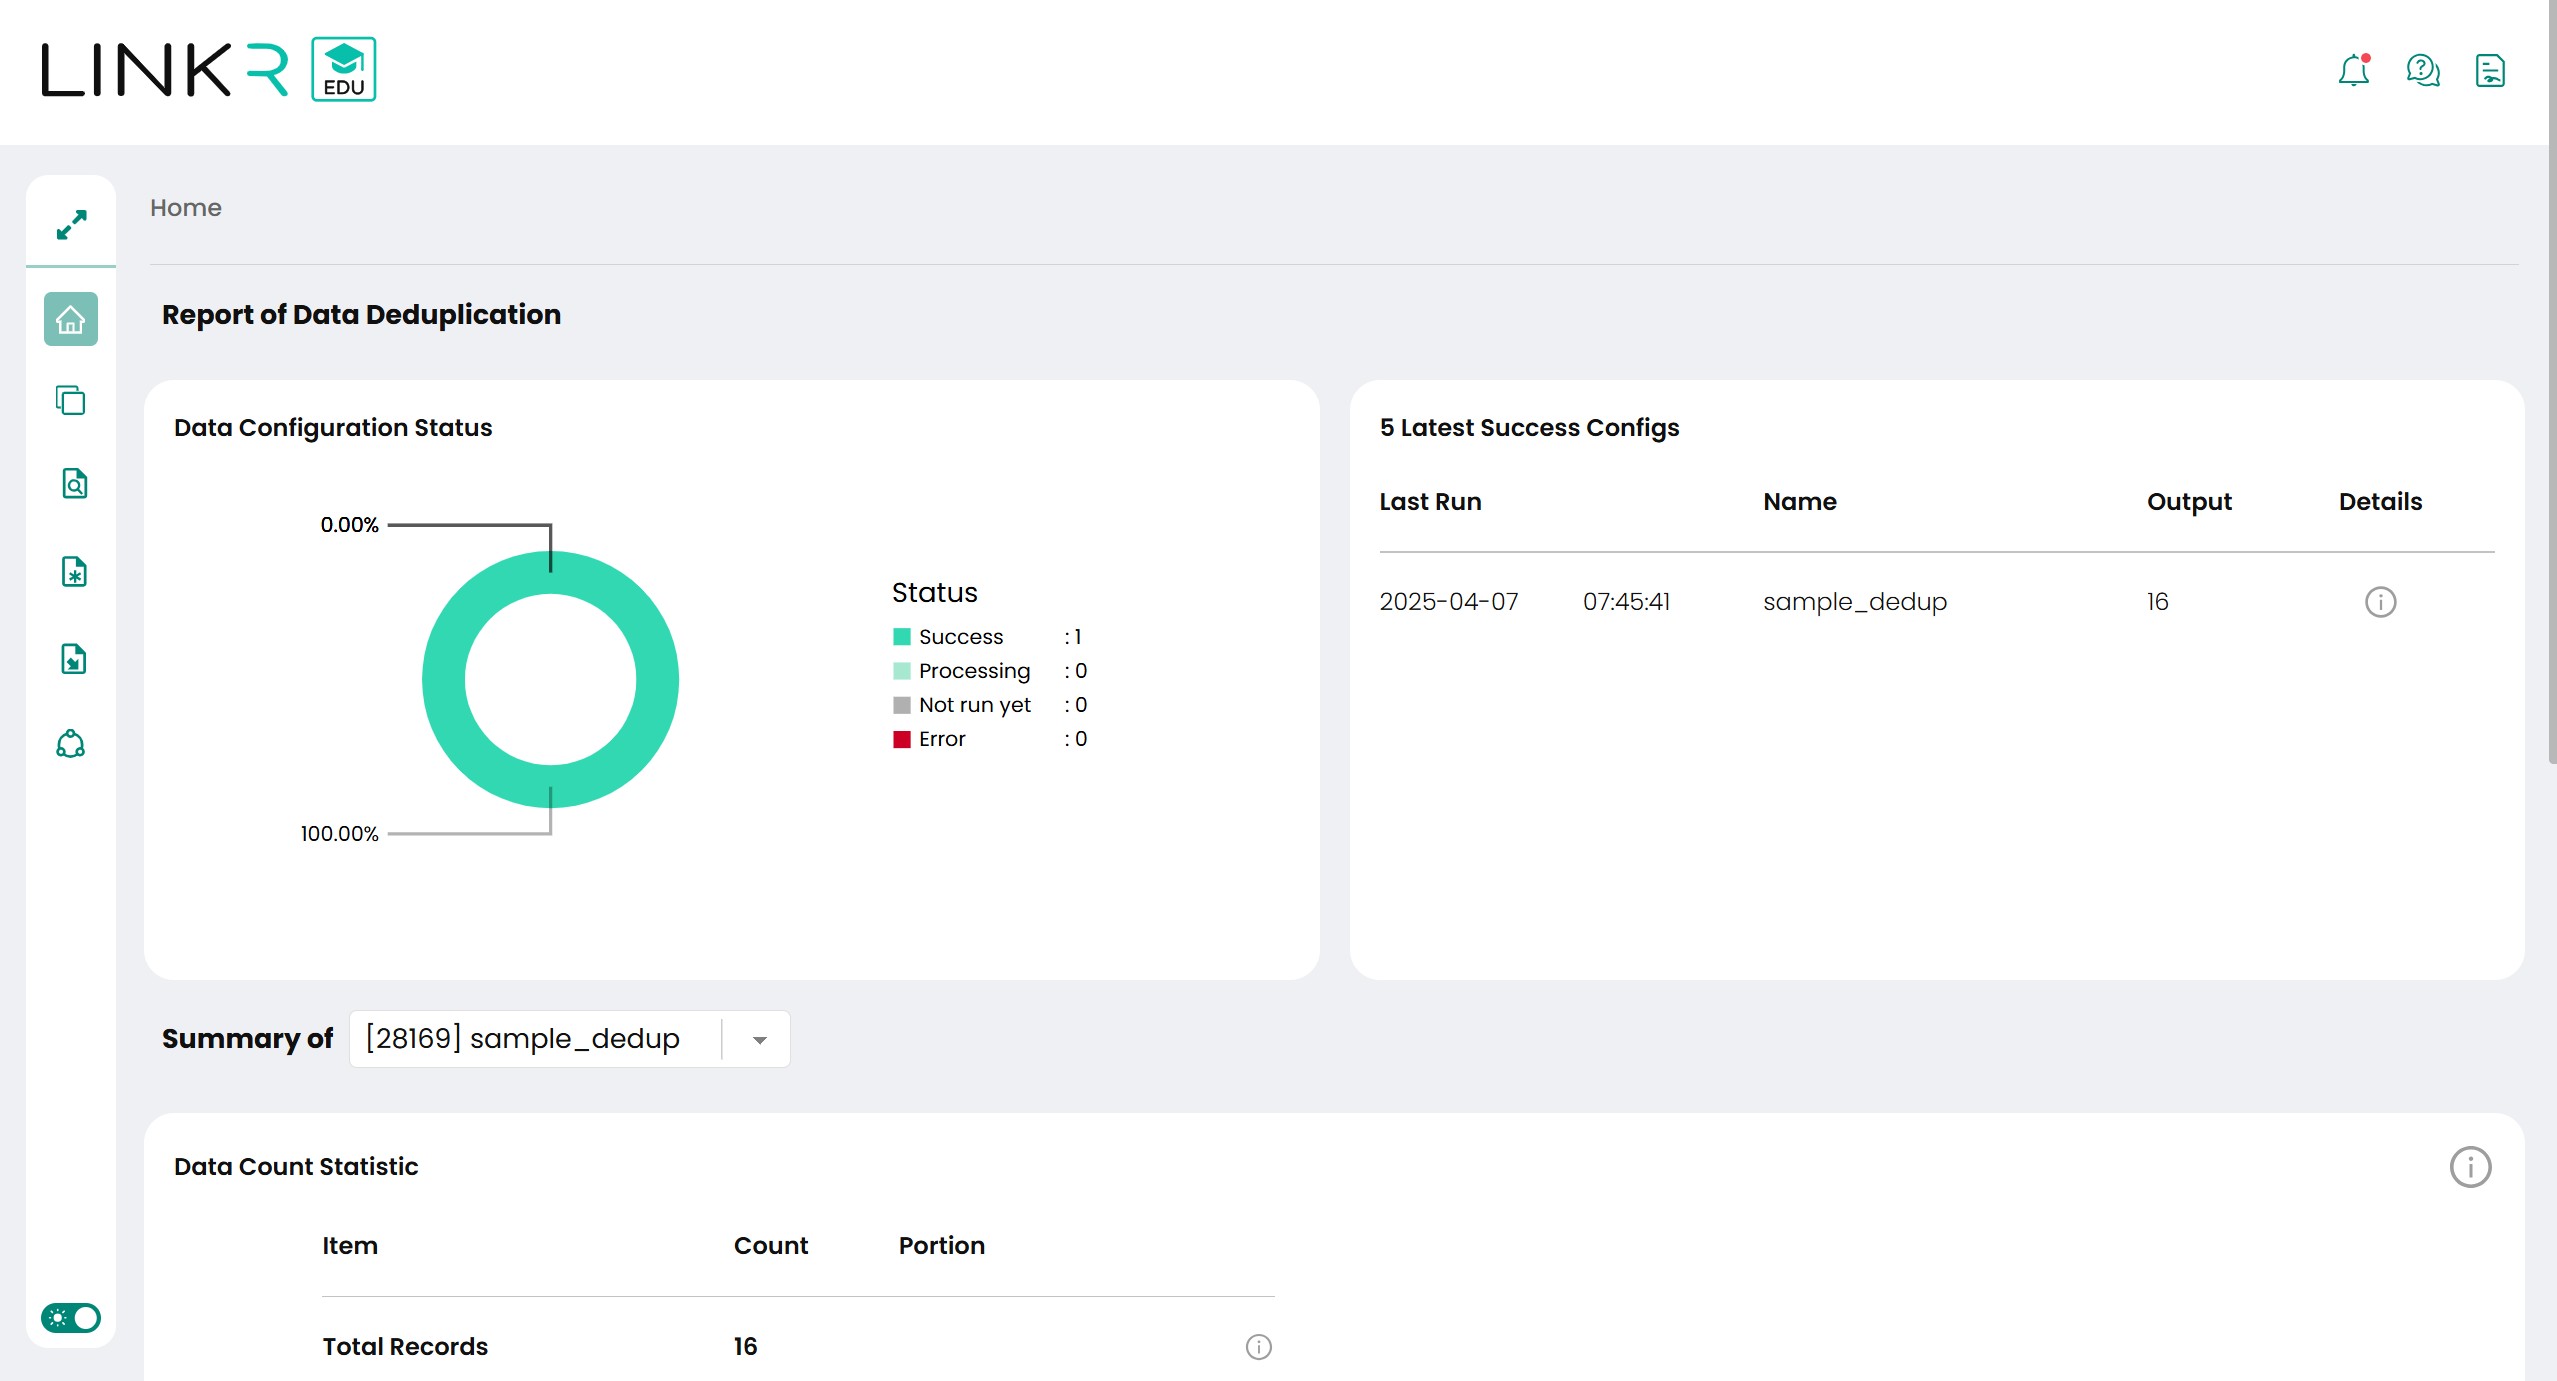
After the application is open, it will go to the home page. On the home page, there are two views, namely the initial display and the display after having the deduplication configuration. The initial display will be like the image below.
The display after having the deduplication configuration will provide a summary of the configuration status, as follows:
-
Create Database Connection
The thing that needs to be done before configuring deduplication and other menus is to create a database connection. If the desired database connection is configured, it can be used immediately.
If neither PostgreSQL nor SQL Server database is installed, LinkR Edu provides a default database connection to h2 named LinkR_Basic.
The steps to create the database connection configuration are as follows:
-
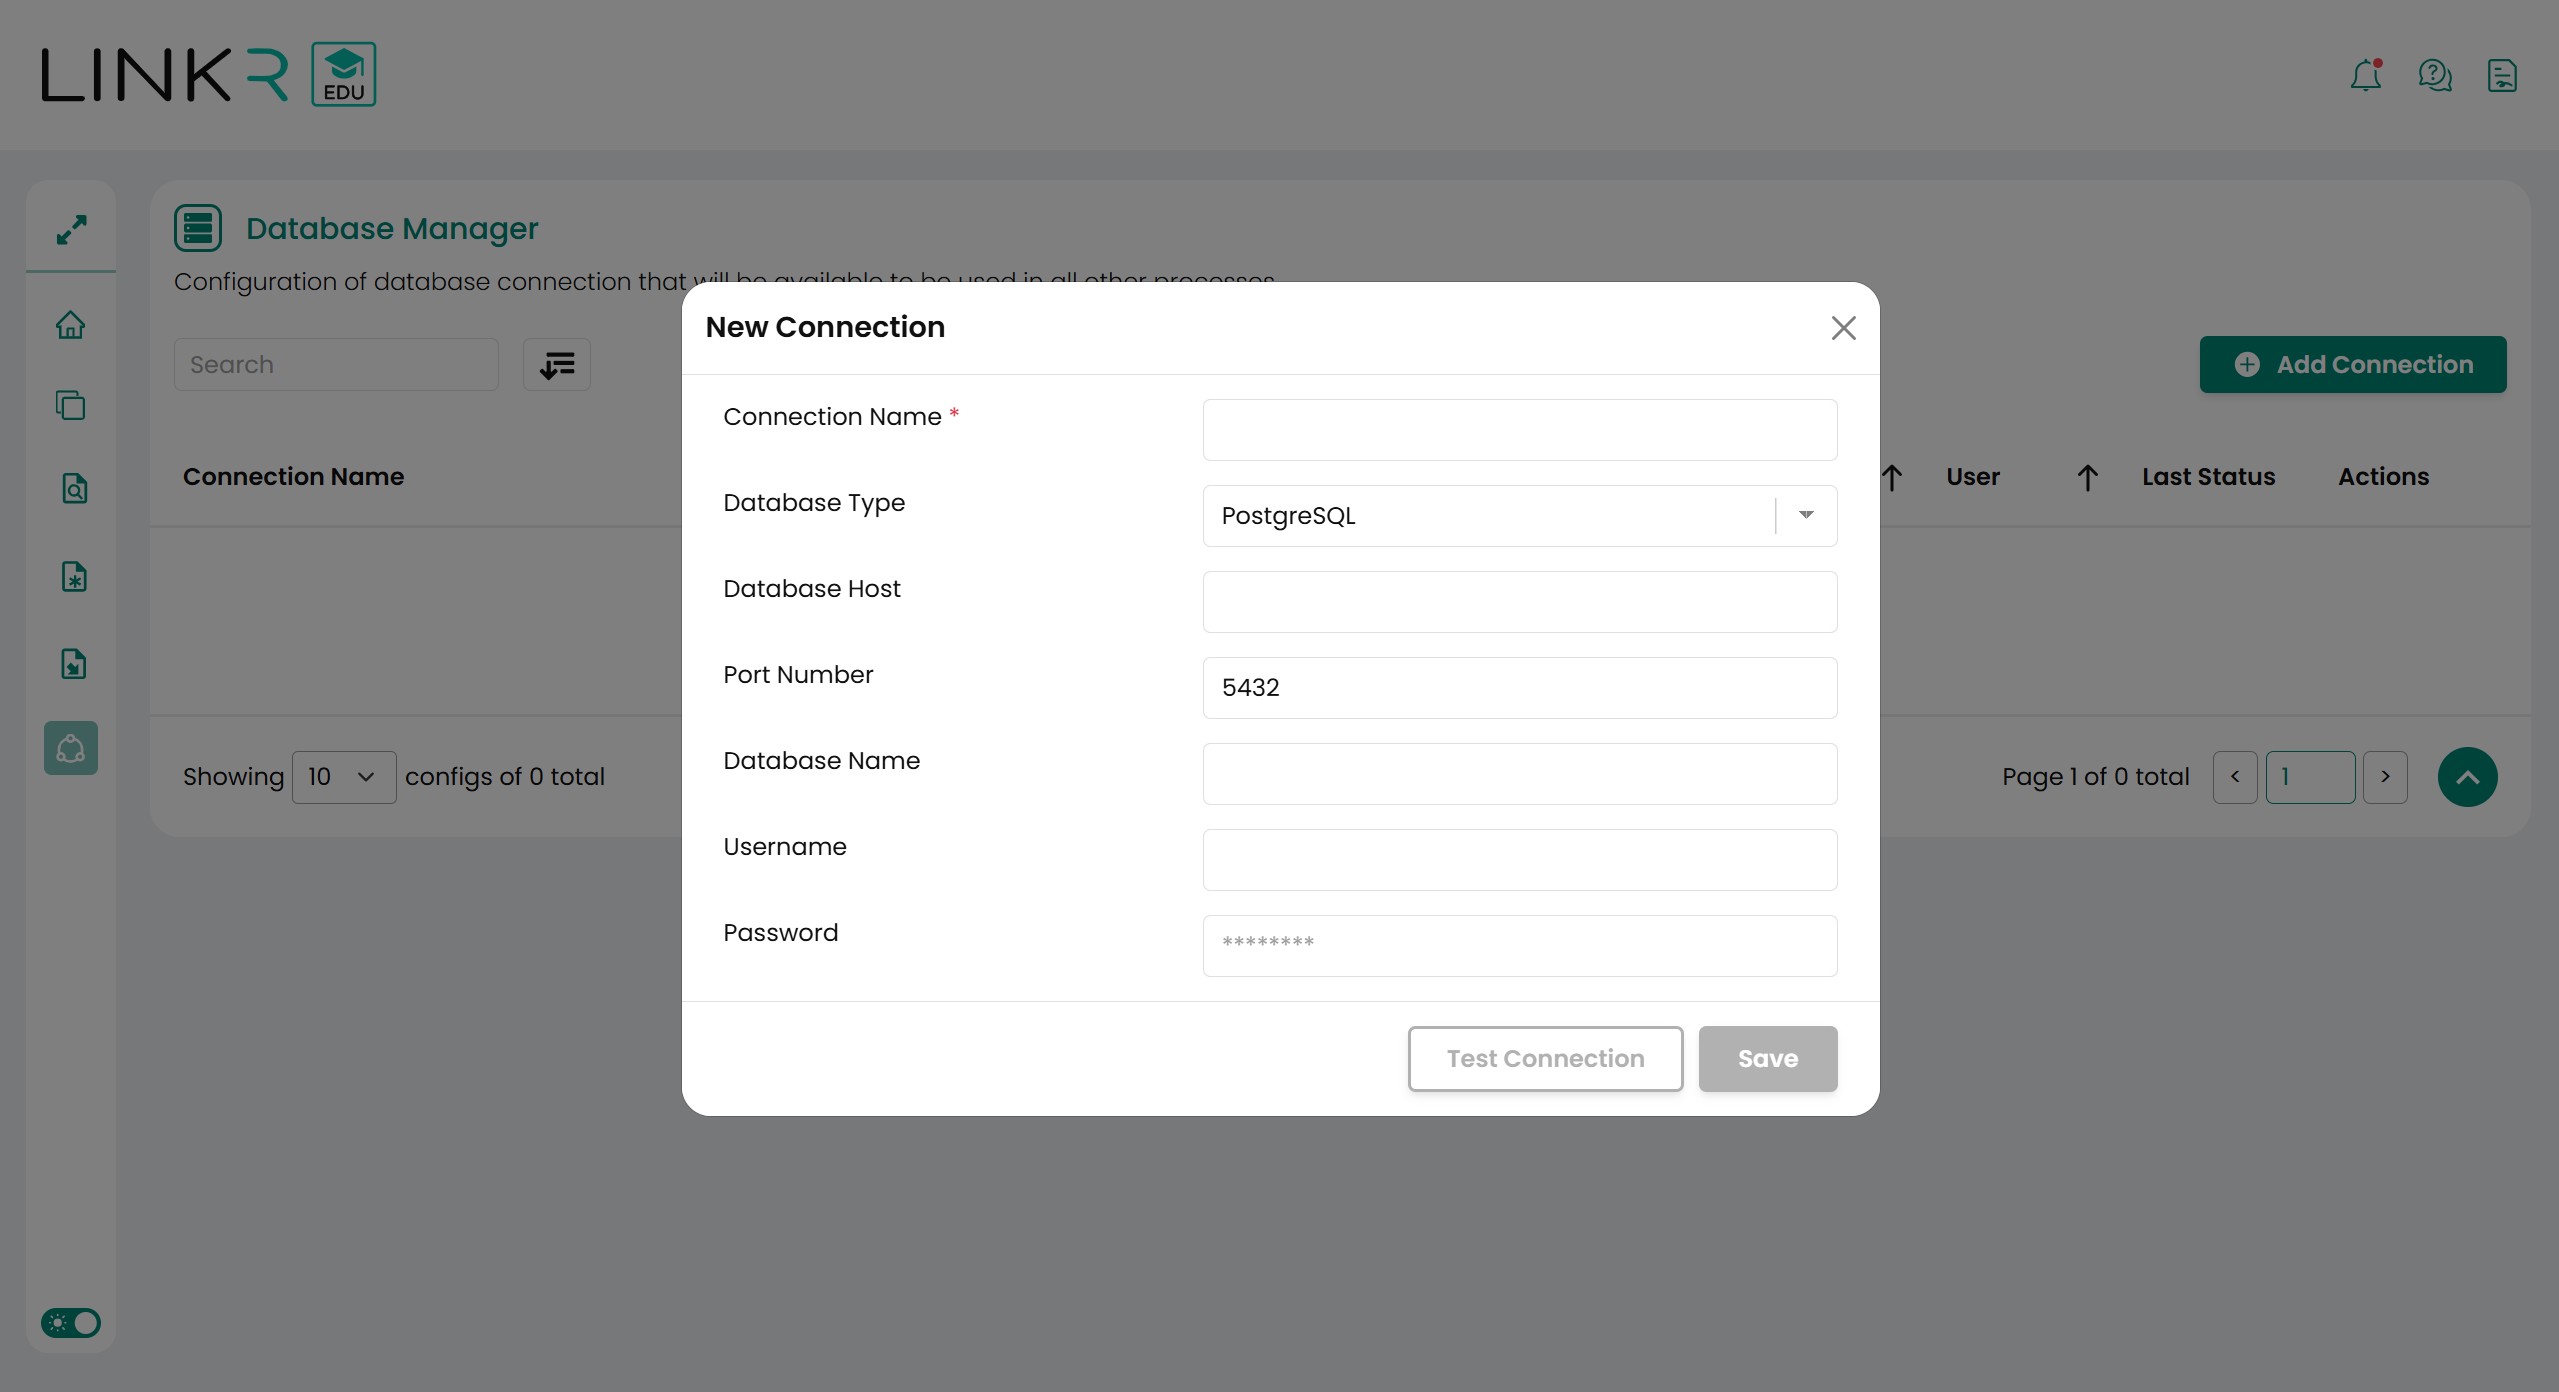
Select the Database Manager menu, the database manager page will display the connections that have been created. Add a new connection by pressing the Add Connection button.
-
The Add Connection button will show a pop up to establish a connection. Fill in the textbox with the desired information. Before saving the connection, you can test the connection by pressing the Test Connection button. After that press the Save button to save the connection.
-
The explanation of New Connection pop up as follows:
Configuration Notes Connection Name Connection Name as identity, connection name must be unique per user. Database Type To identify the database
PS: Database type that supported are PostgreSQL, SQLServer, SQLServer Windows Auth, H2 dan H2 Embedded
Database Host IP Address host Database Port Number Port used by the database Database Name Instance or name of the database Username Username to access the database Password Password to access the database -
After the connection information has been inputted, the connection can be tested via the Test Connection button.
-
The saved connections will appear in the connection list. Those connections can be modified and deleted.
The saved connections will appear on the Database Manager page. The explanation of the button functions on the Database Manager page is as follows:
Button Notes Test Connection Test connection using the saved connection information. Edit To Edit the saved connection.
Change information like Port, User, Password, and etc.
Delete Delete the database connection -
-
Data Staging
-
Create Data Staging Configuration
On the Data Staging menu, users can insert data from excel, csv and tsv files into other database tables that will be used for other features. This step is not required if the connection and data source to be used are already available and can be used for data deduplication and data profiling.
Data staging consists of several datasets, each dataset can have several import settings (config) and files. Configs and files in a dataset cannot be accessed by other datasets.
The steps for using the data staging menu are as follows:
-
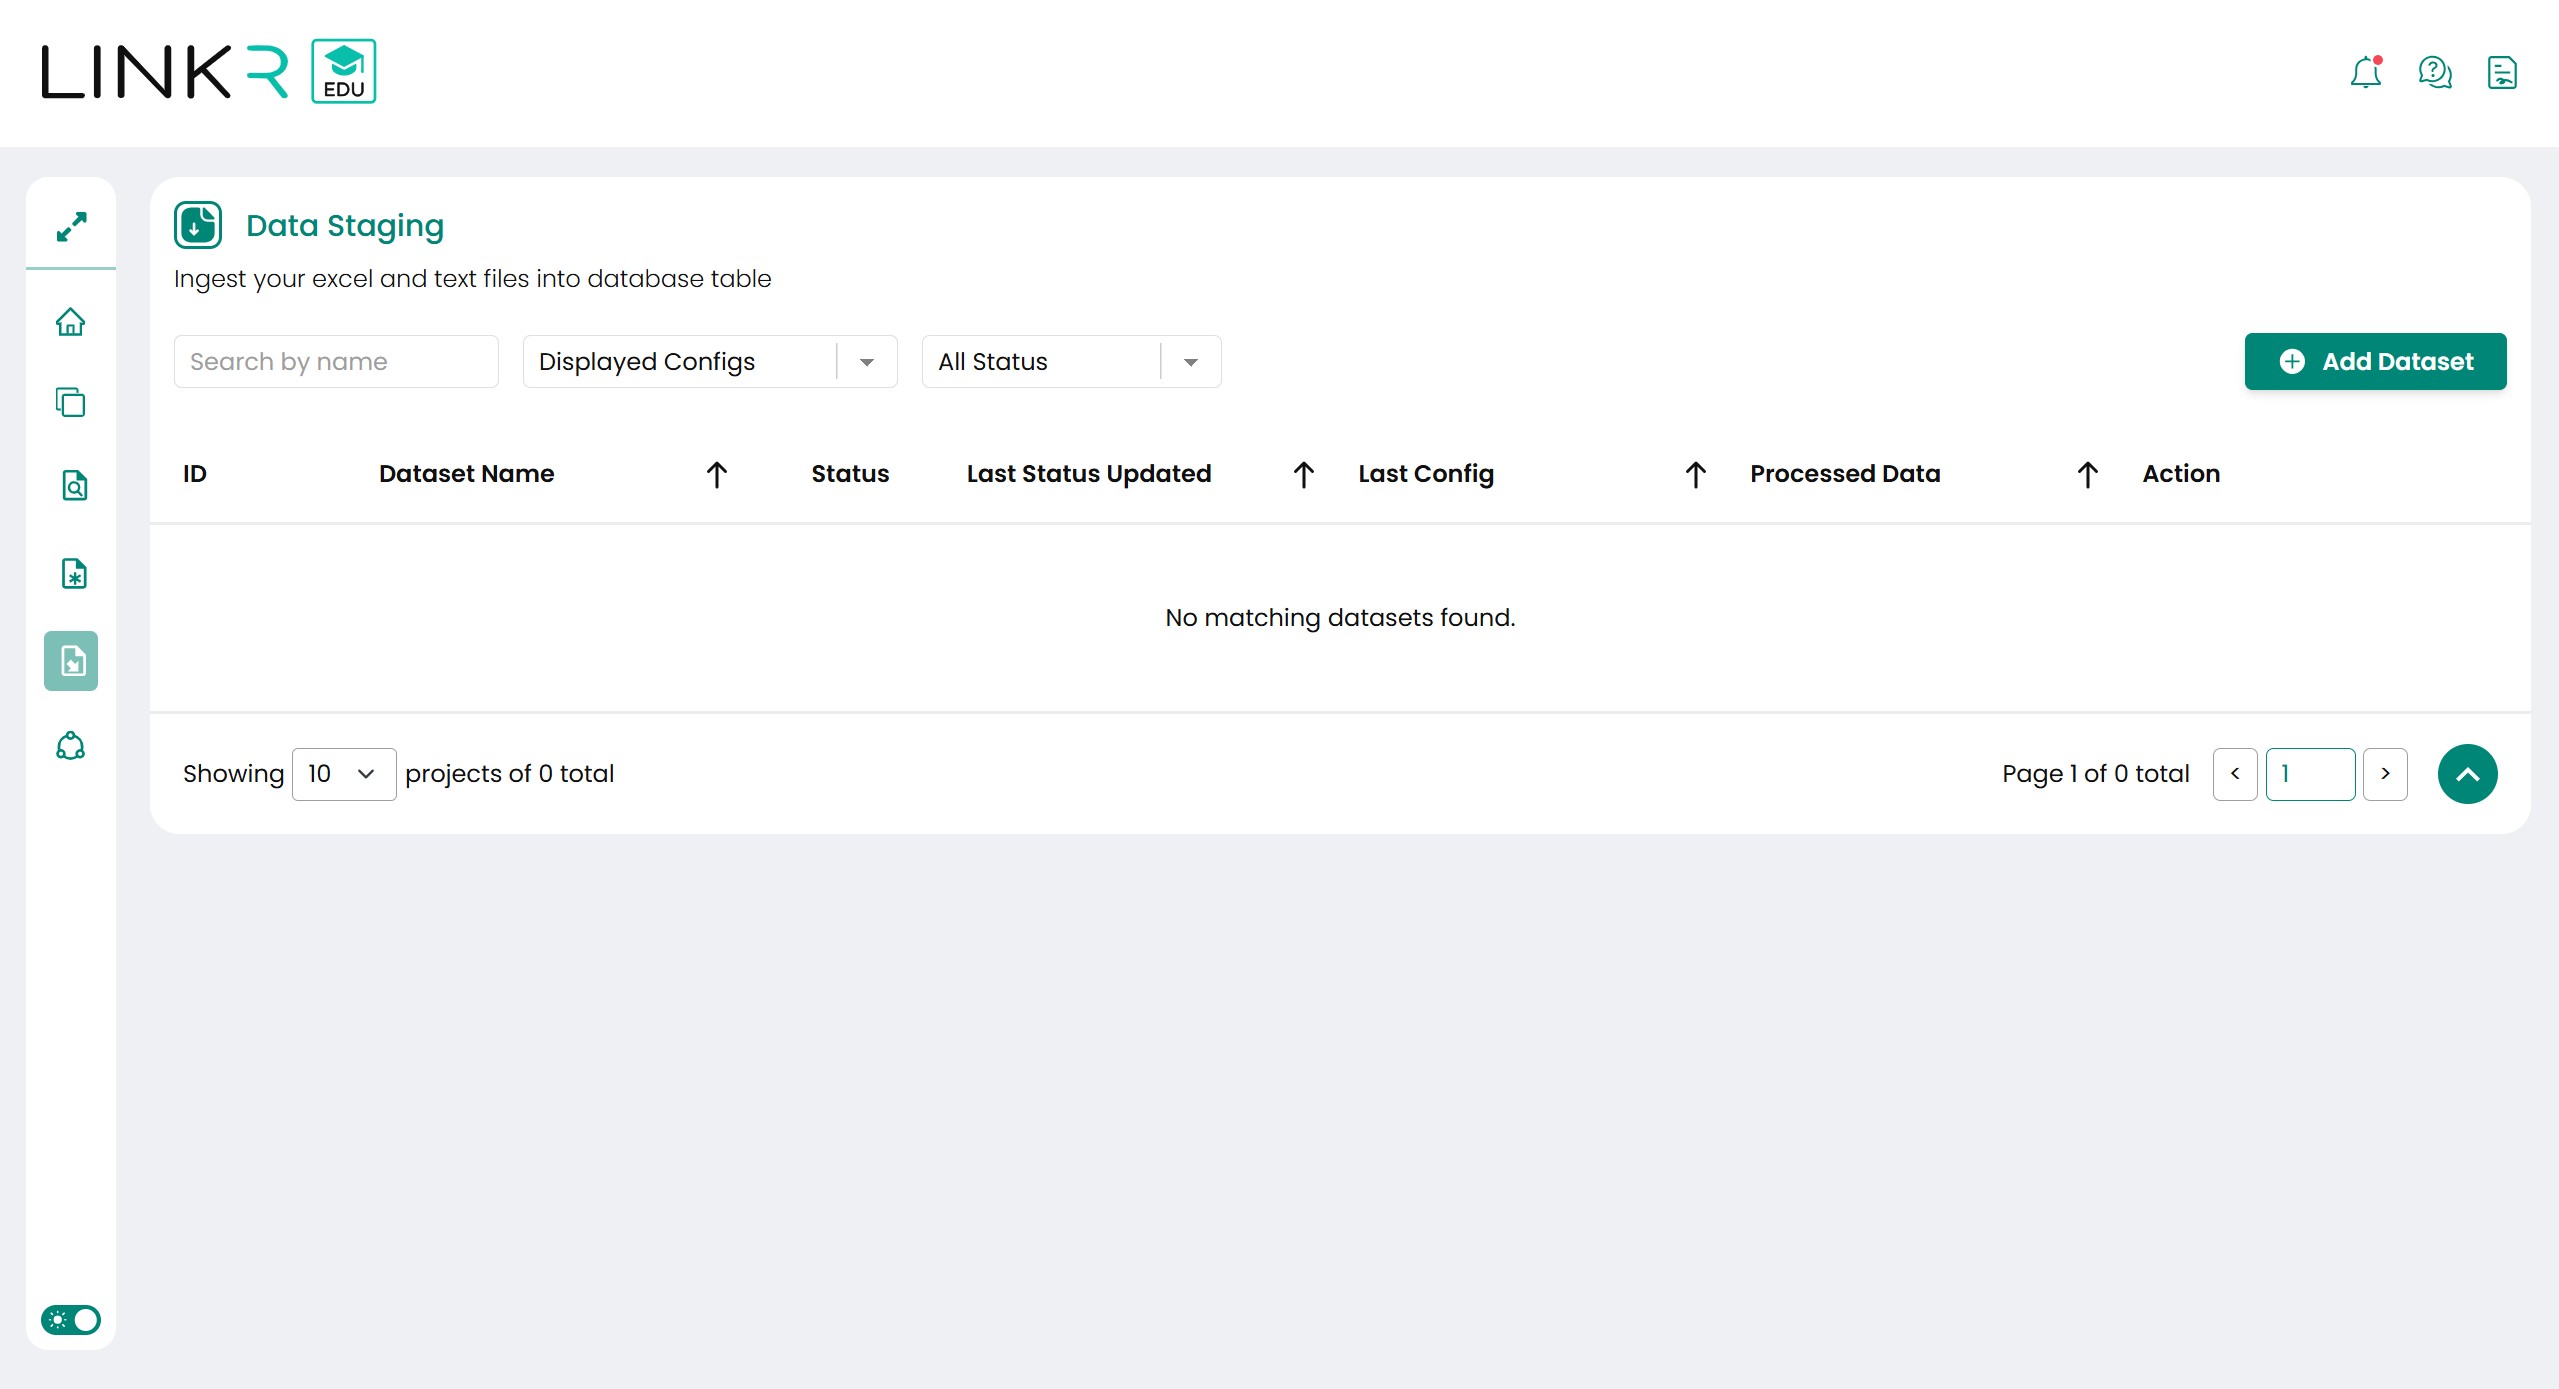
Select the Data Staging menu, the page will display a list of datasets that have been formed and run. Press the Add Dataset button to create a new dataset. A dataset can hold multiple files and configurations.
-
The next step is to make staging configurations according to your needs. The required configuration will be in accordance with the selected import settings. An example of the initial configuration display, as shown below:
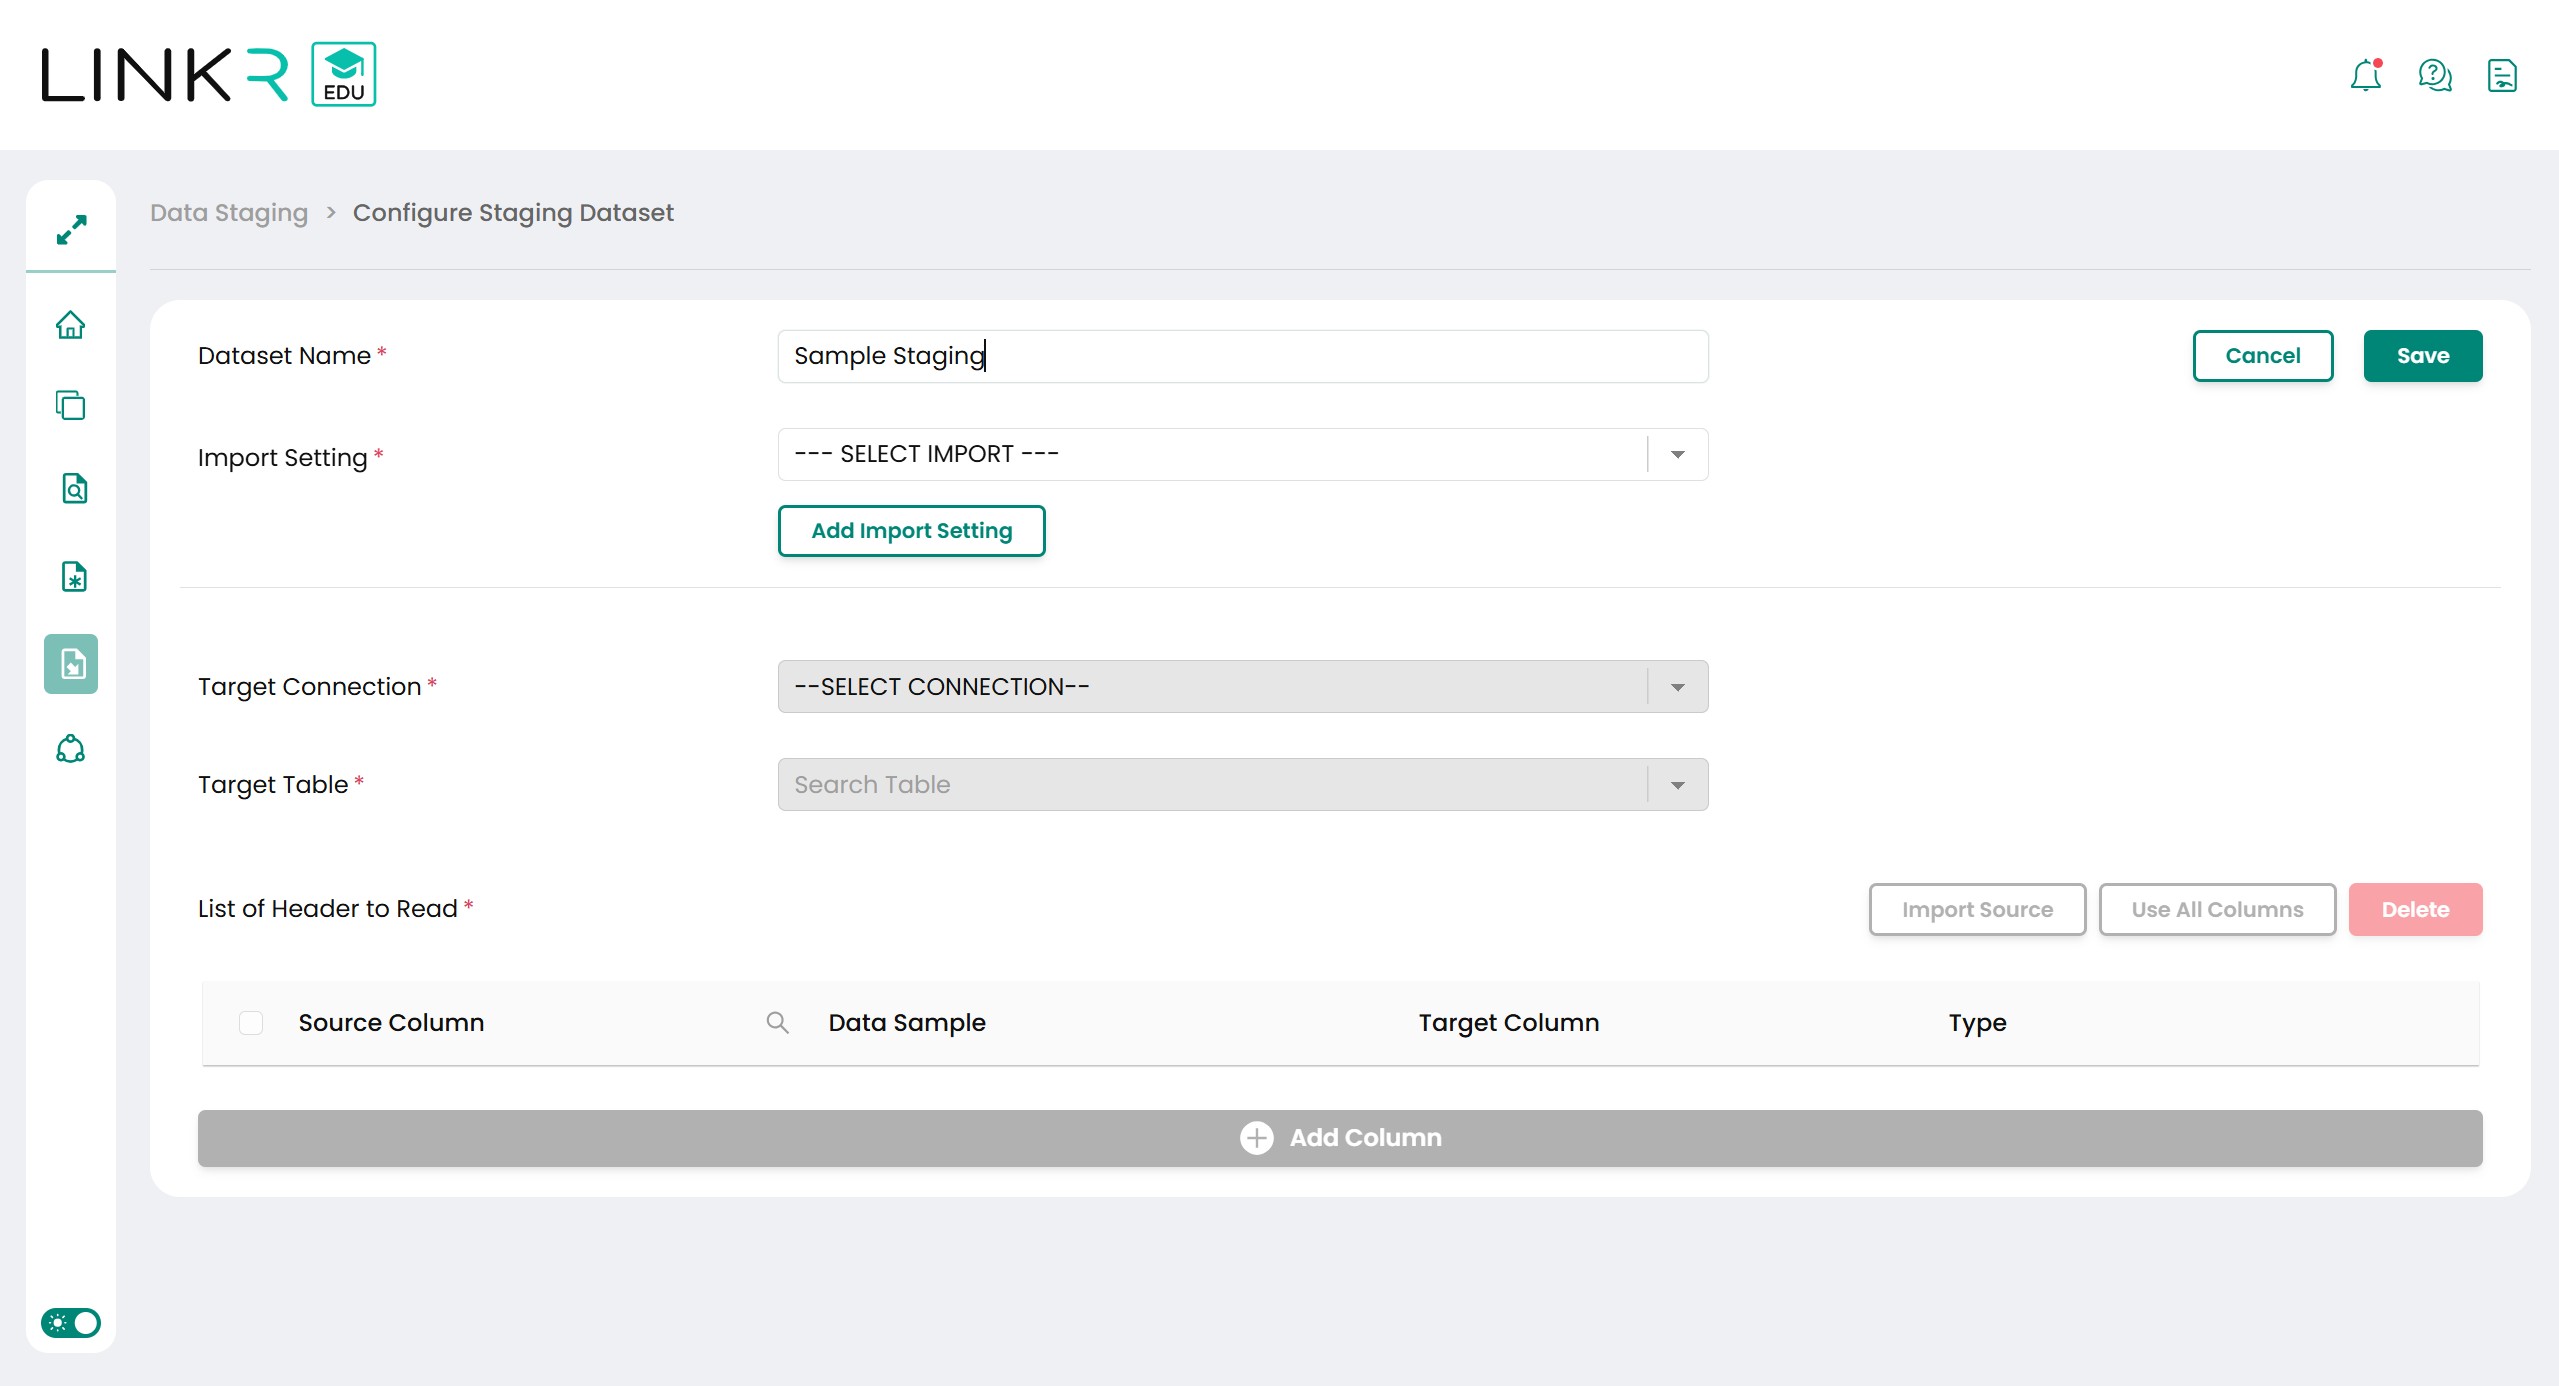
-
There are 2 types of staging configurations, namely Text Files and Excel Files. The explanation for each configuration is as follows:
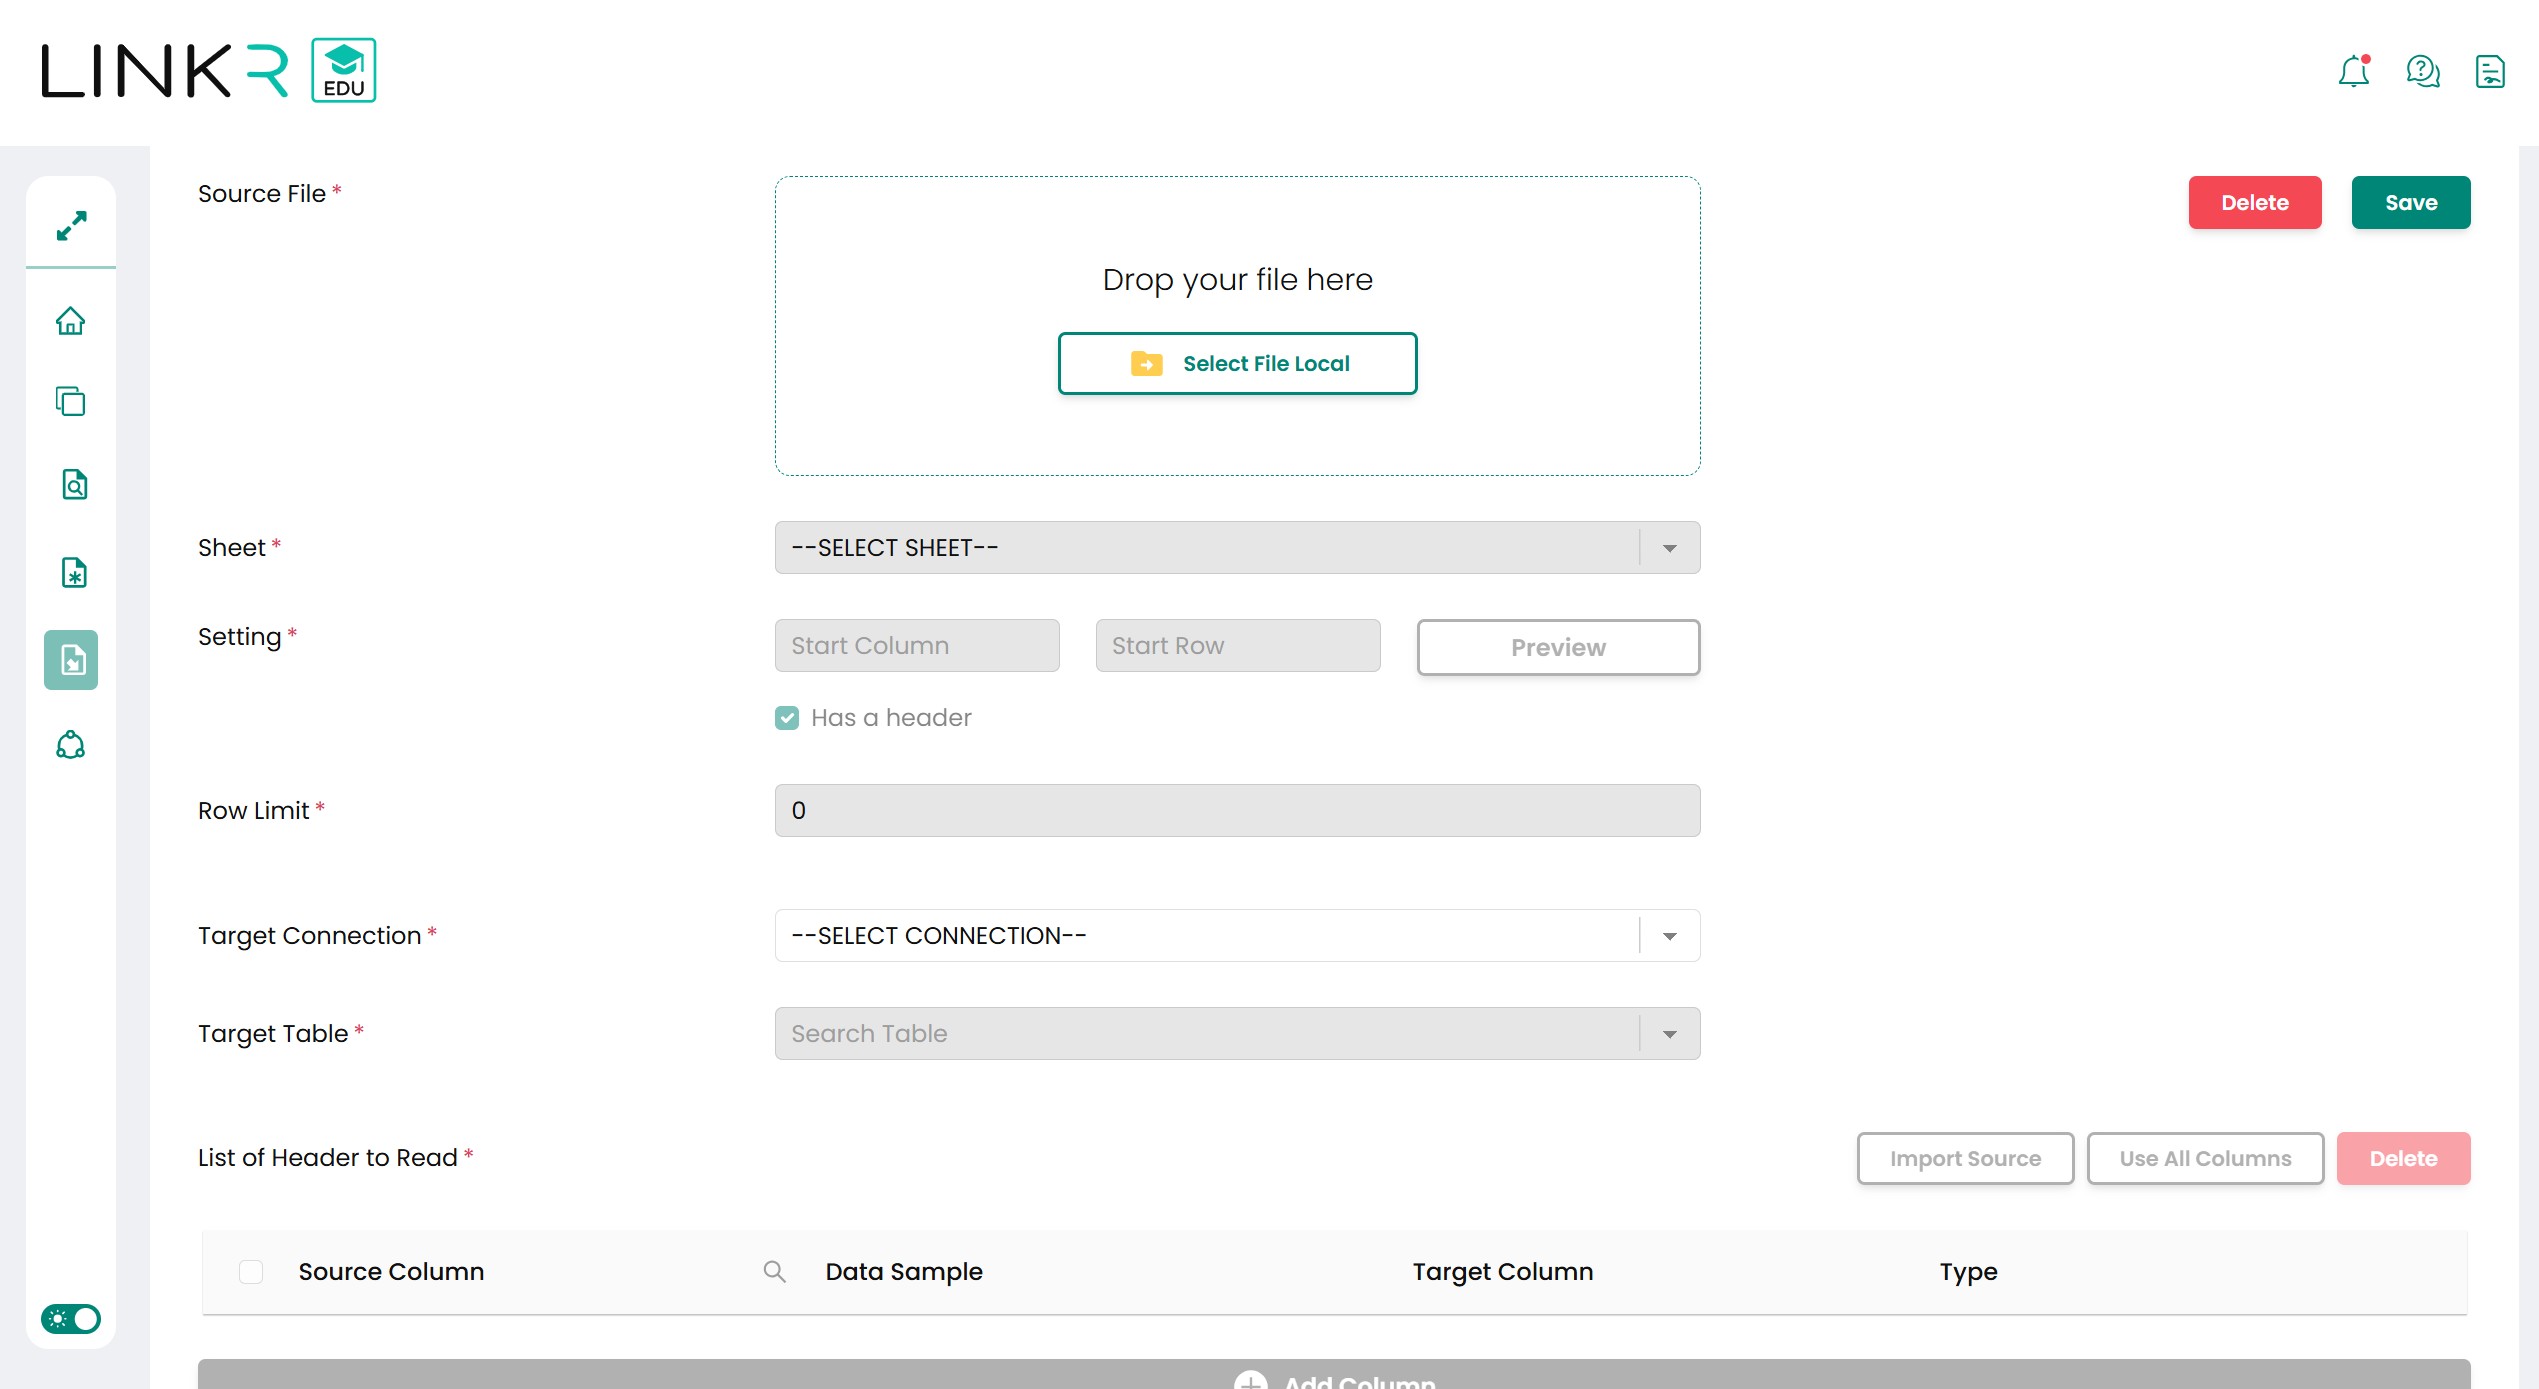
Configuration Notes Source File A place to upload files to be processed. Sheet Menu for staging excel. Selecting the excel sheet to be processed. Setting The settings for staging excel are Start Column and Start Row. Start Column is filled with the excel column alphabet and Start Row is filled with excel row numbers. Button Preview serves to help select the Start Column and Start Row.
If Has a header is checked then the first row will be considered as a table header and vice versa.
Row Limit The number of rows to be processed and inserted into the table. If the value is 0 then it will process all rows. 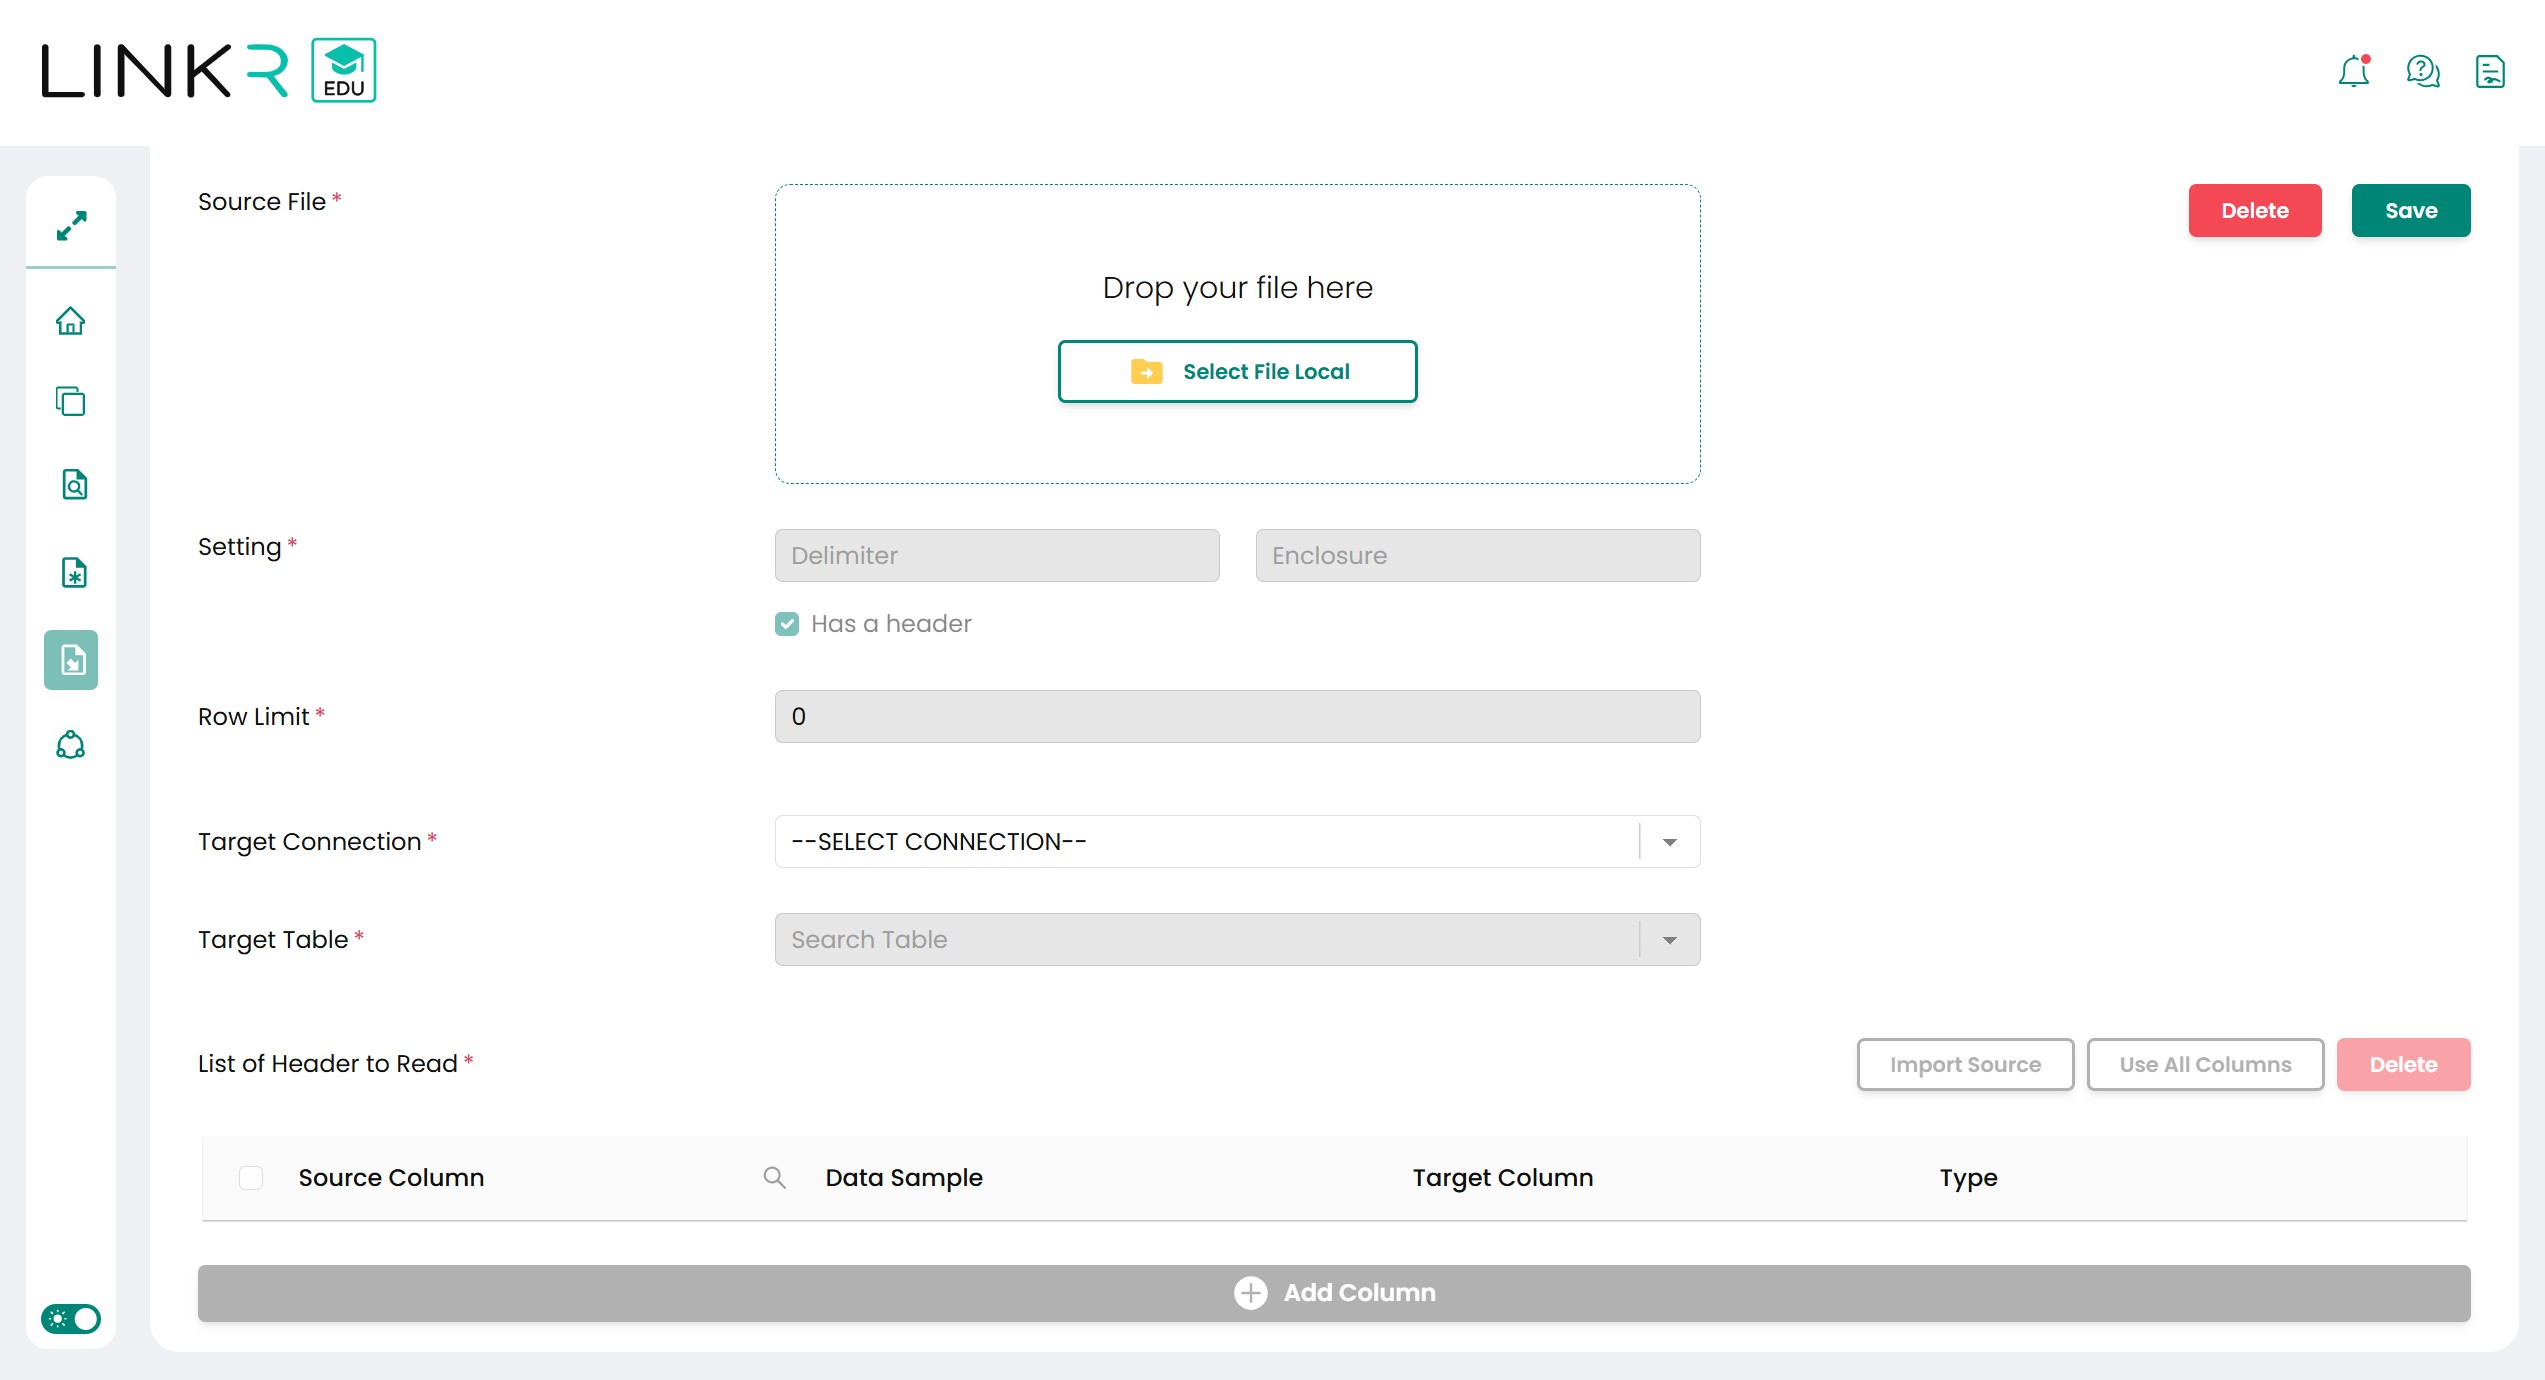
Configuration Notes Source File A place to upload files to be processed. Setting The settings for staging text are Delimiter and Enclosure. If the Delimiter and Enclosure are not filled then the application will automatically try to get the value from the file when it is processed. Delimiter is a column separator symbol in a text file. Enclosure is the opening and closing symbols of a cell (certain columns and rows).
If Has a header is checked then the first row will be considered as a table header and vice versa.
Row Limit The number of rows to be processed and inserted into the table. If the value is 0 then it will process all rows. -
For an explanation of the configuration and buttons at the bottom in the excel staging and staging text, they are as follows:
Configuration Notes Target Connection Destination database where the staging data will be entered. Target Table The dropdown will be filled with the list of tables in the selected connection.
The New Table button on the right serves to change the target table into a textbox to form a new target table that doesn't exist yet.
Import Source Button to retrieve source column information and sample data from files and settings used.
This button must be pressed first before using the settings below.
Use All Columns Button to use all the columns read from the import source process and perform auto mapping to the target table column. Source Column List of source columns that will be mapped and used to fill in the target column. Data Sample Example of data in the column obtained from the source file. Target Column The column to be filled from the source column. Will be a textbox if in a new table condition. The yellow key symbol on the right indicates the primary key column (can be more than one column). Type Column data type in target table.
-
-
Run the Staging Process
The staging process can be run by pressing the run button on the dataset list or configuration as shown below. There will be a progress bar on the name of the configuration being processed. When it's finished, the status of the configuration will check.
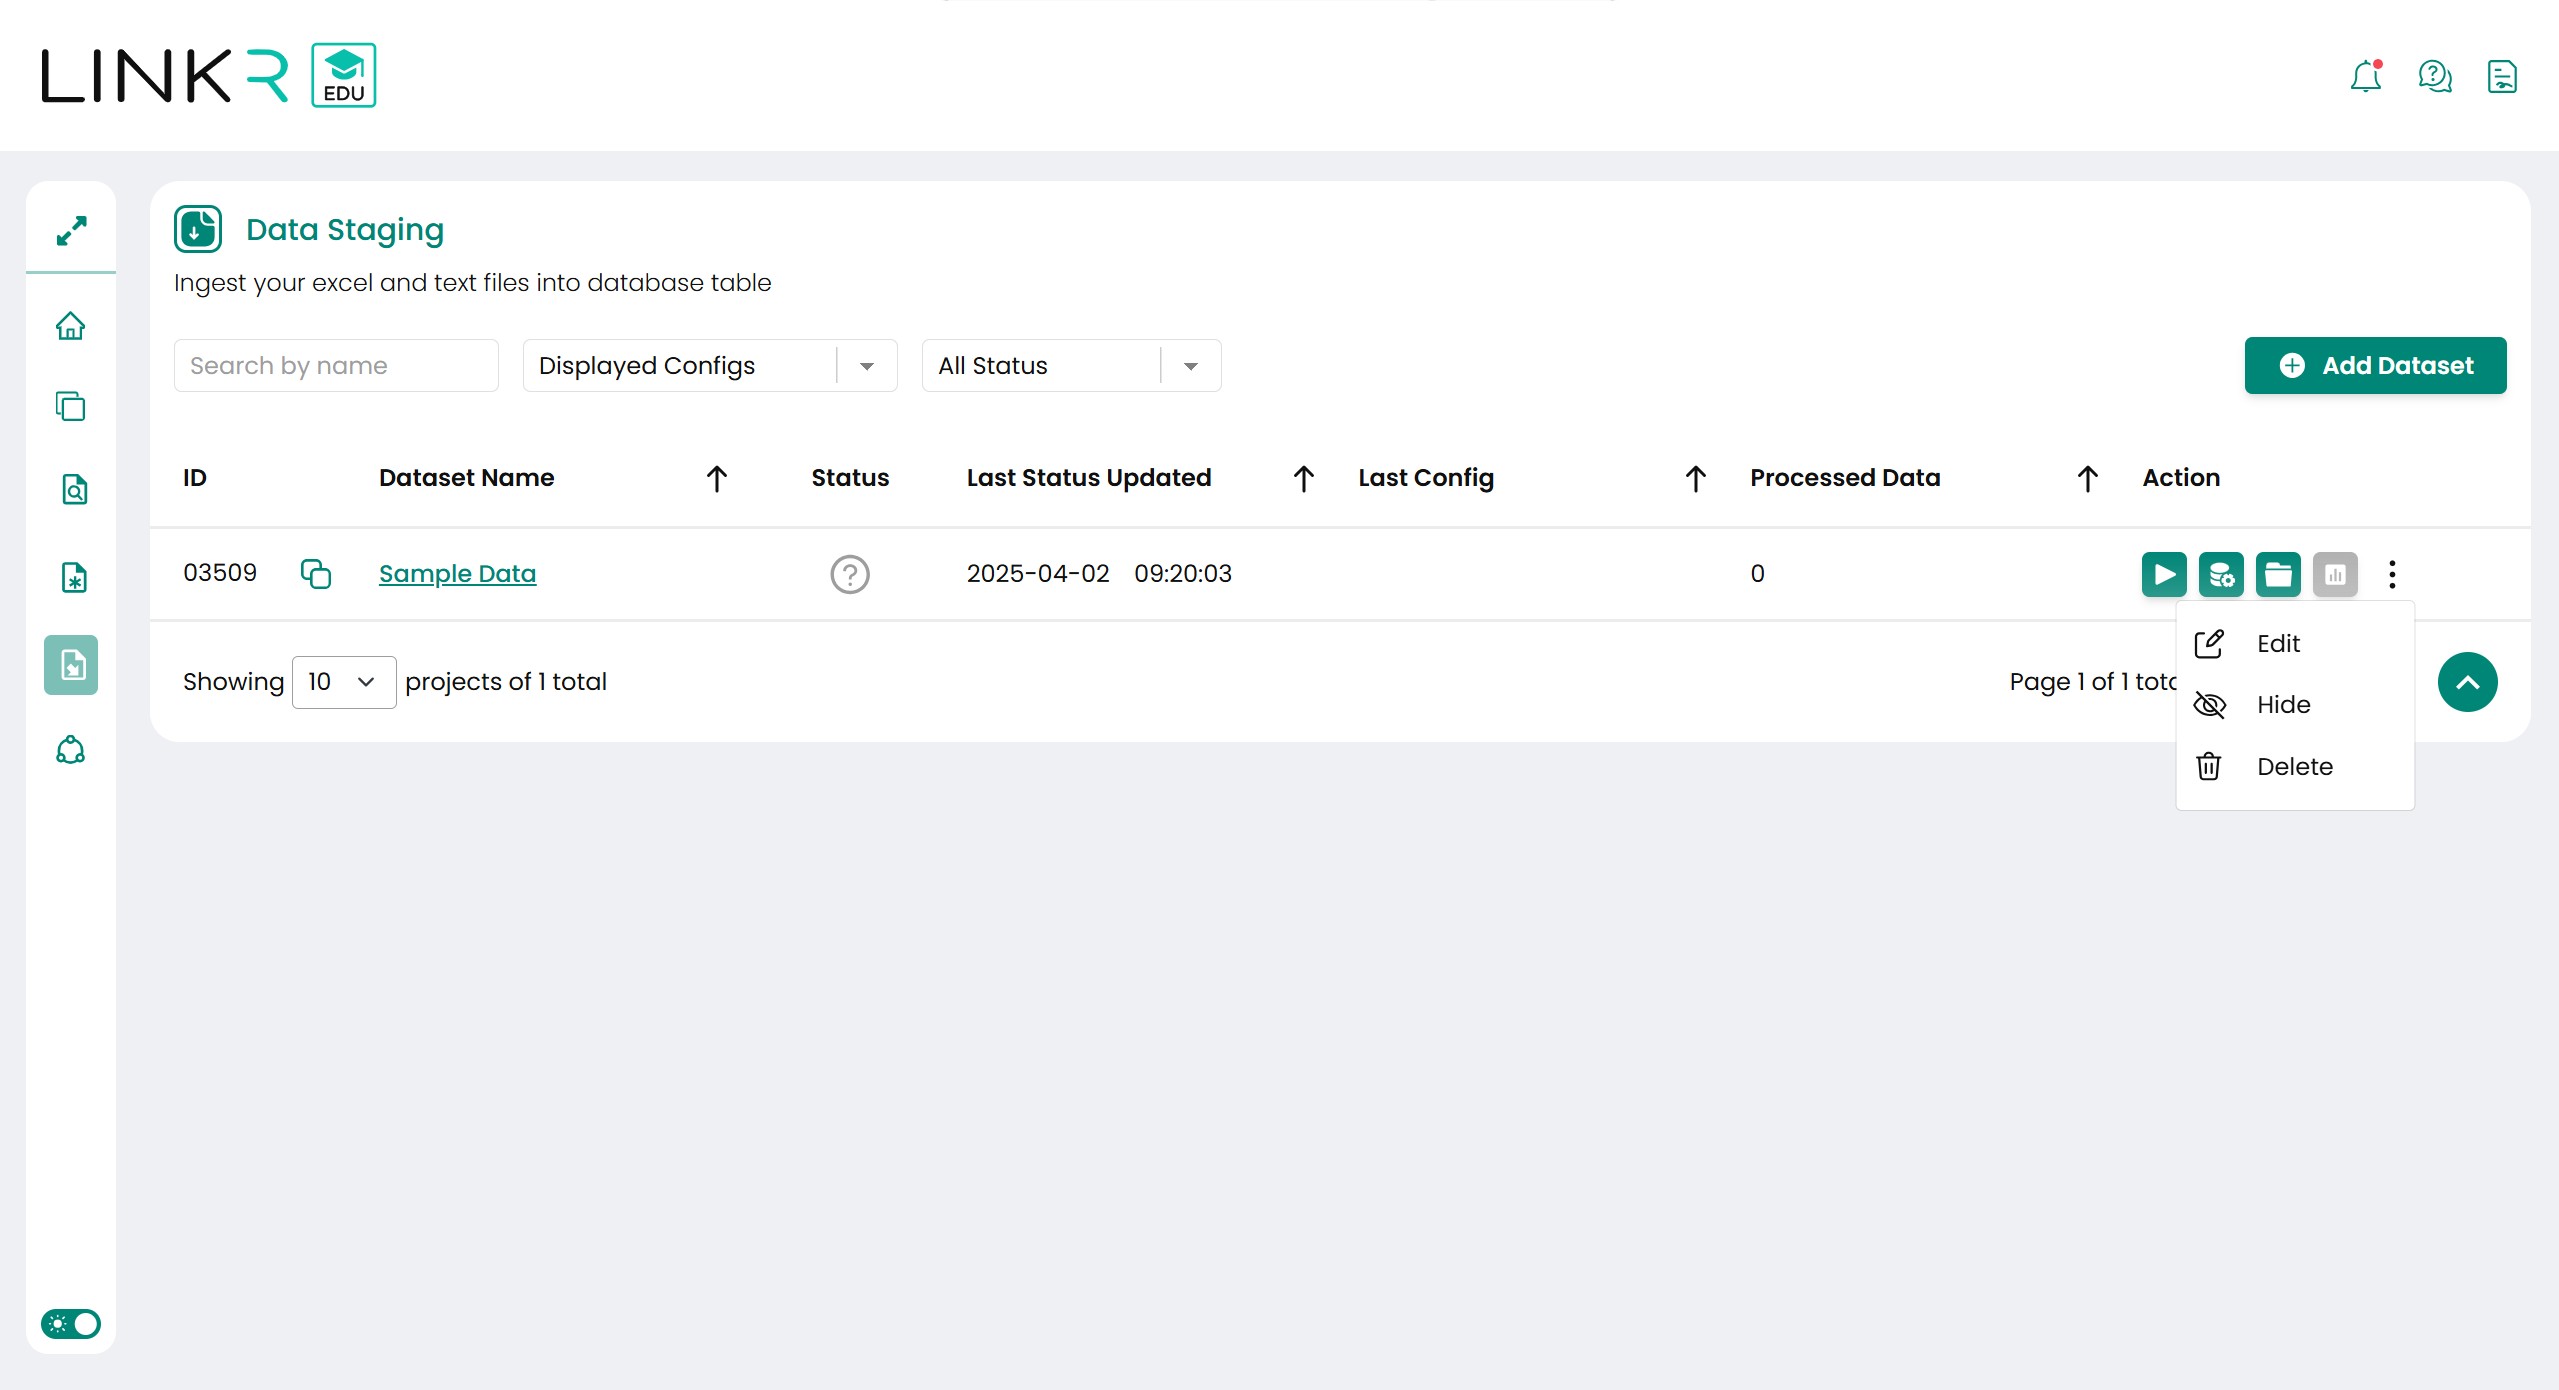
The functions of the buttons in the Action column are as follows:
Button Notes Run Dataset Runs the staging process of all configurations on the dataset. Configs Move to the config list page of the dataset. Files Move to the uploaded file list page for the dataset. Summary Summary page of the staging process for the dataset. Contains percentages and a list of data that goes to the target table. Edit Move to the configuration page to view or change configurations. Hide / Show Hide configurations so that they are not visible on the home page or vice versa. Delete Delete the configuration and files associated with the configuration.
-
-
Data Standardization
-
Create Data Standardization Configuration
Using Data Standardization features, user could create new table with additional columns. The additional columns will have standardized value. This step is optional according to user’s requirements. The target table will be recreated each process.
The standardization process is a rule-based standardization grouped in a domain. Domain is a group or scope of standardization rules that contains the rules to be used for standardization.
The steps to use the data standardization menu are as follows:
-
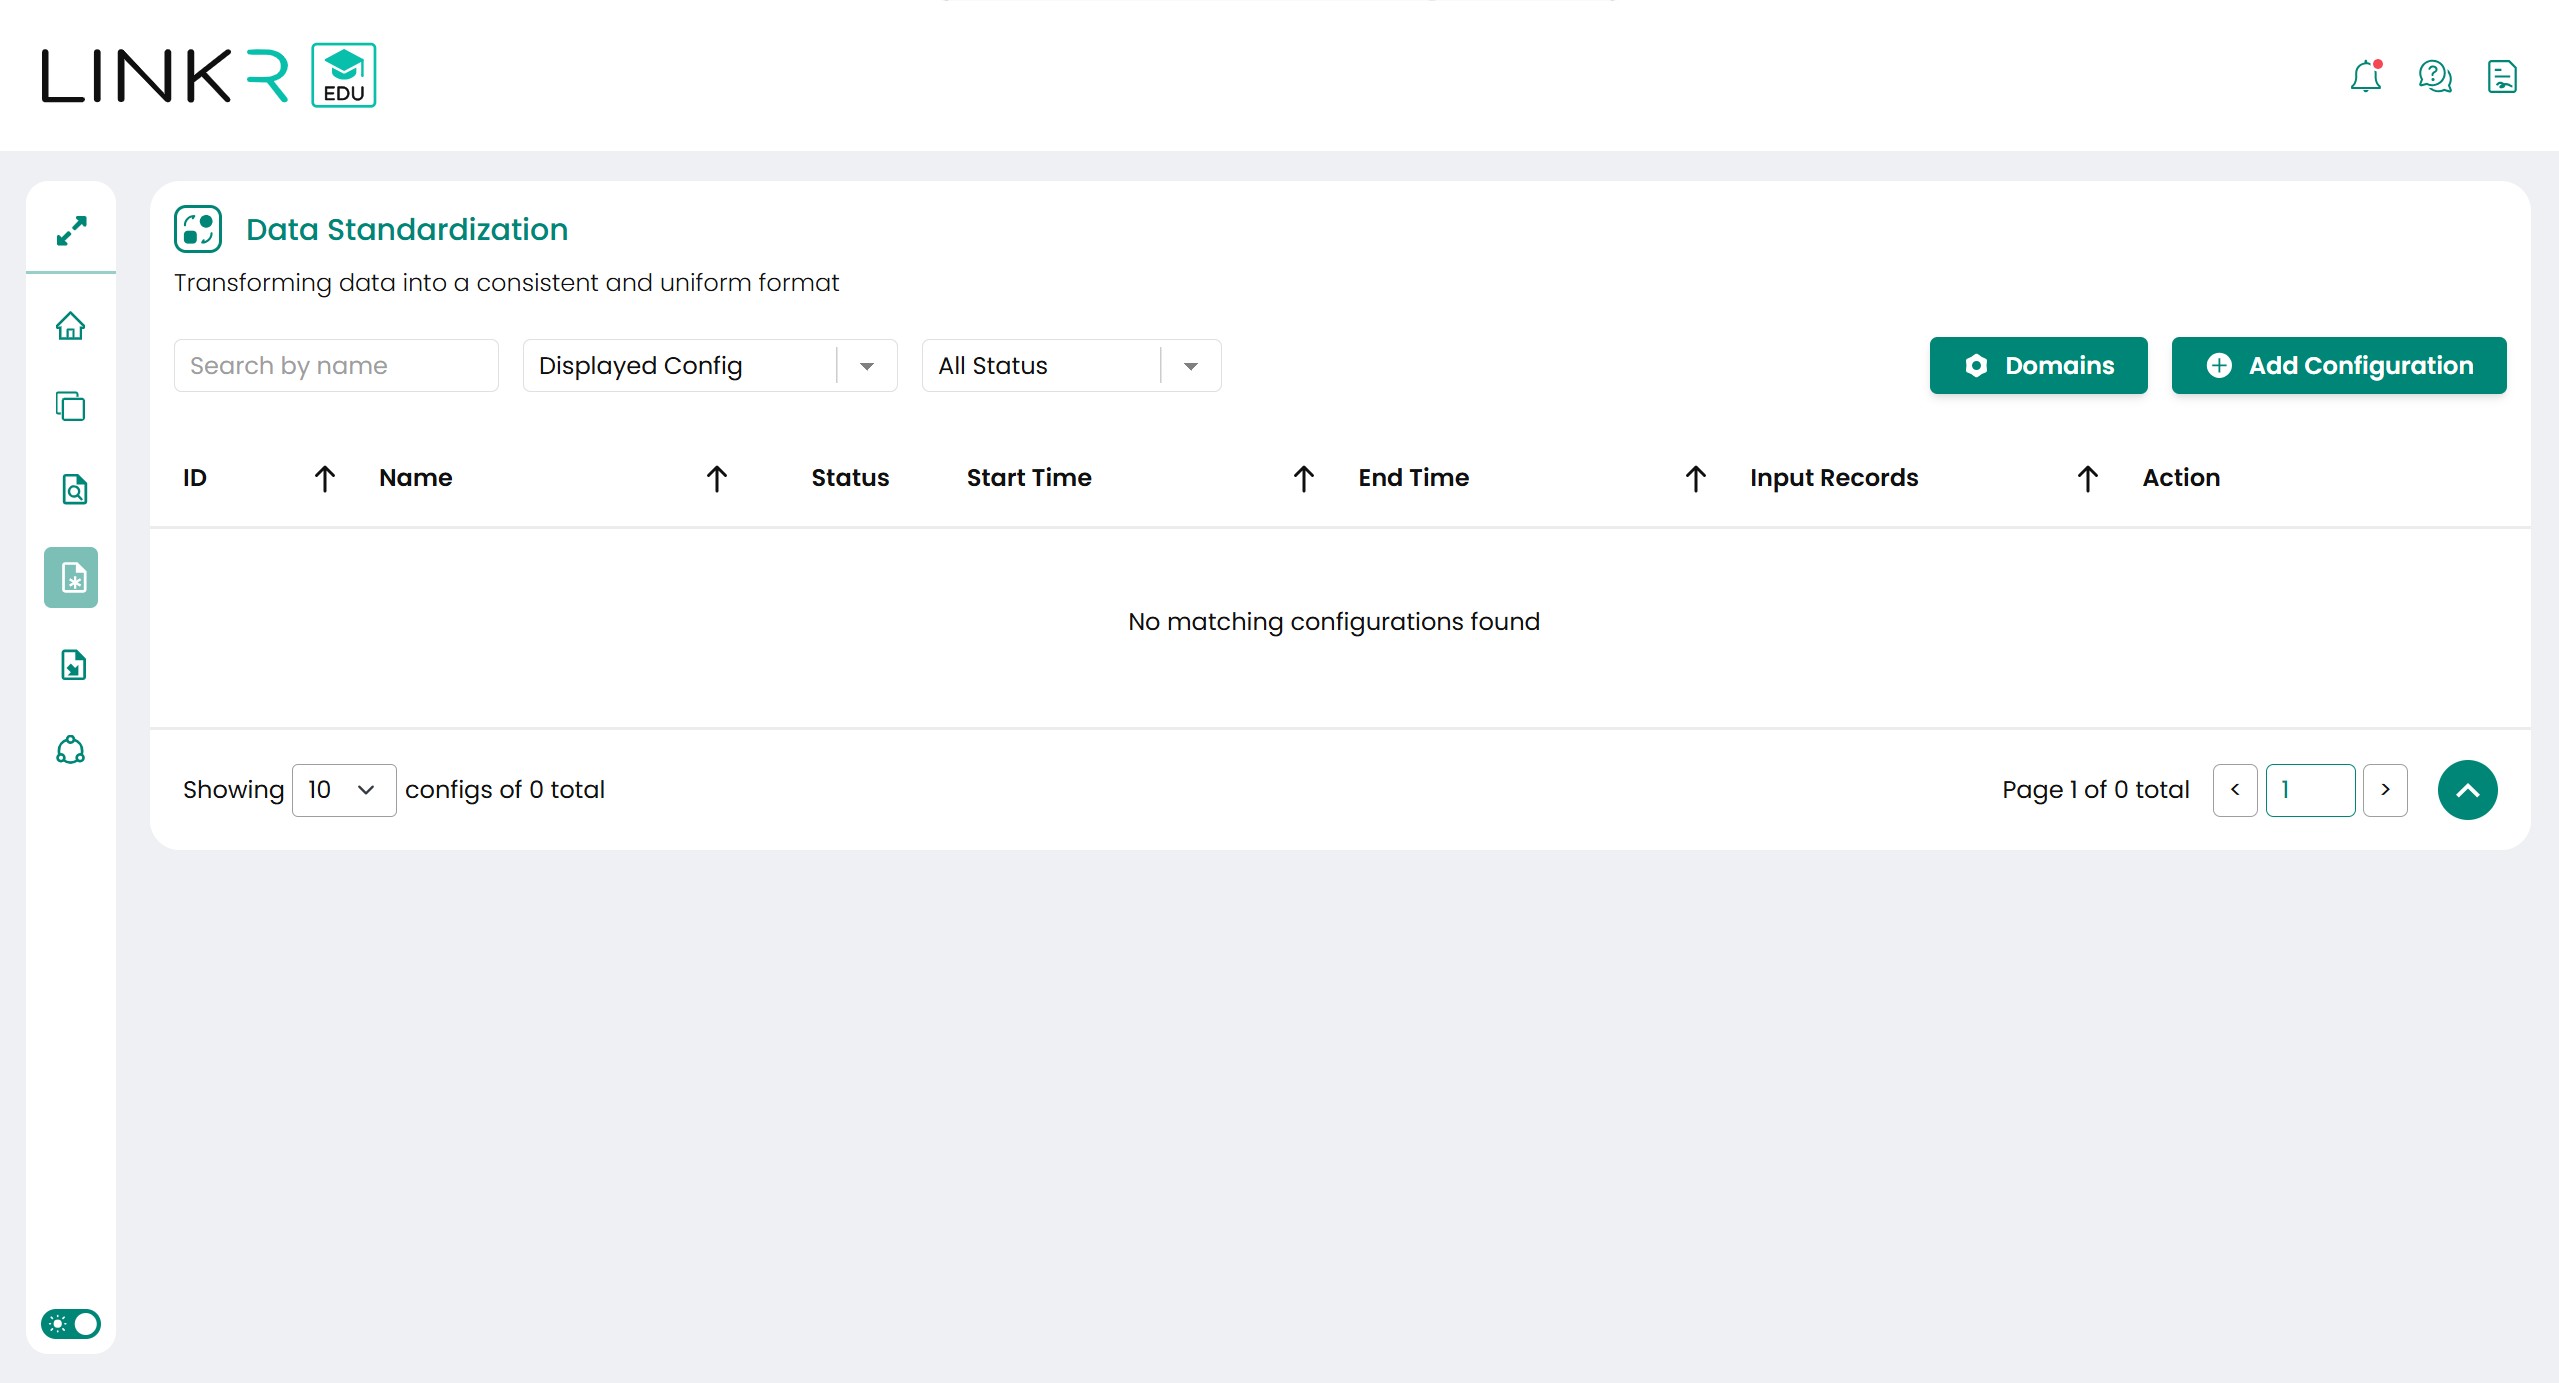
Go to Data Standardization menu, this page has list of configurations. Press Add Configuration button to create a new configuration.
-
For the next step, create standardization configurations based on your needs. Insert the source table, target table, and additional columns. The configuration example, as shown below:
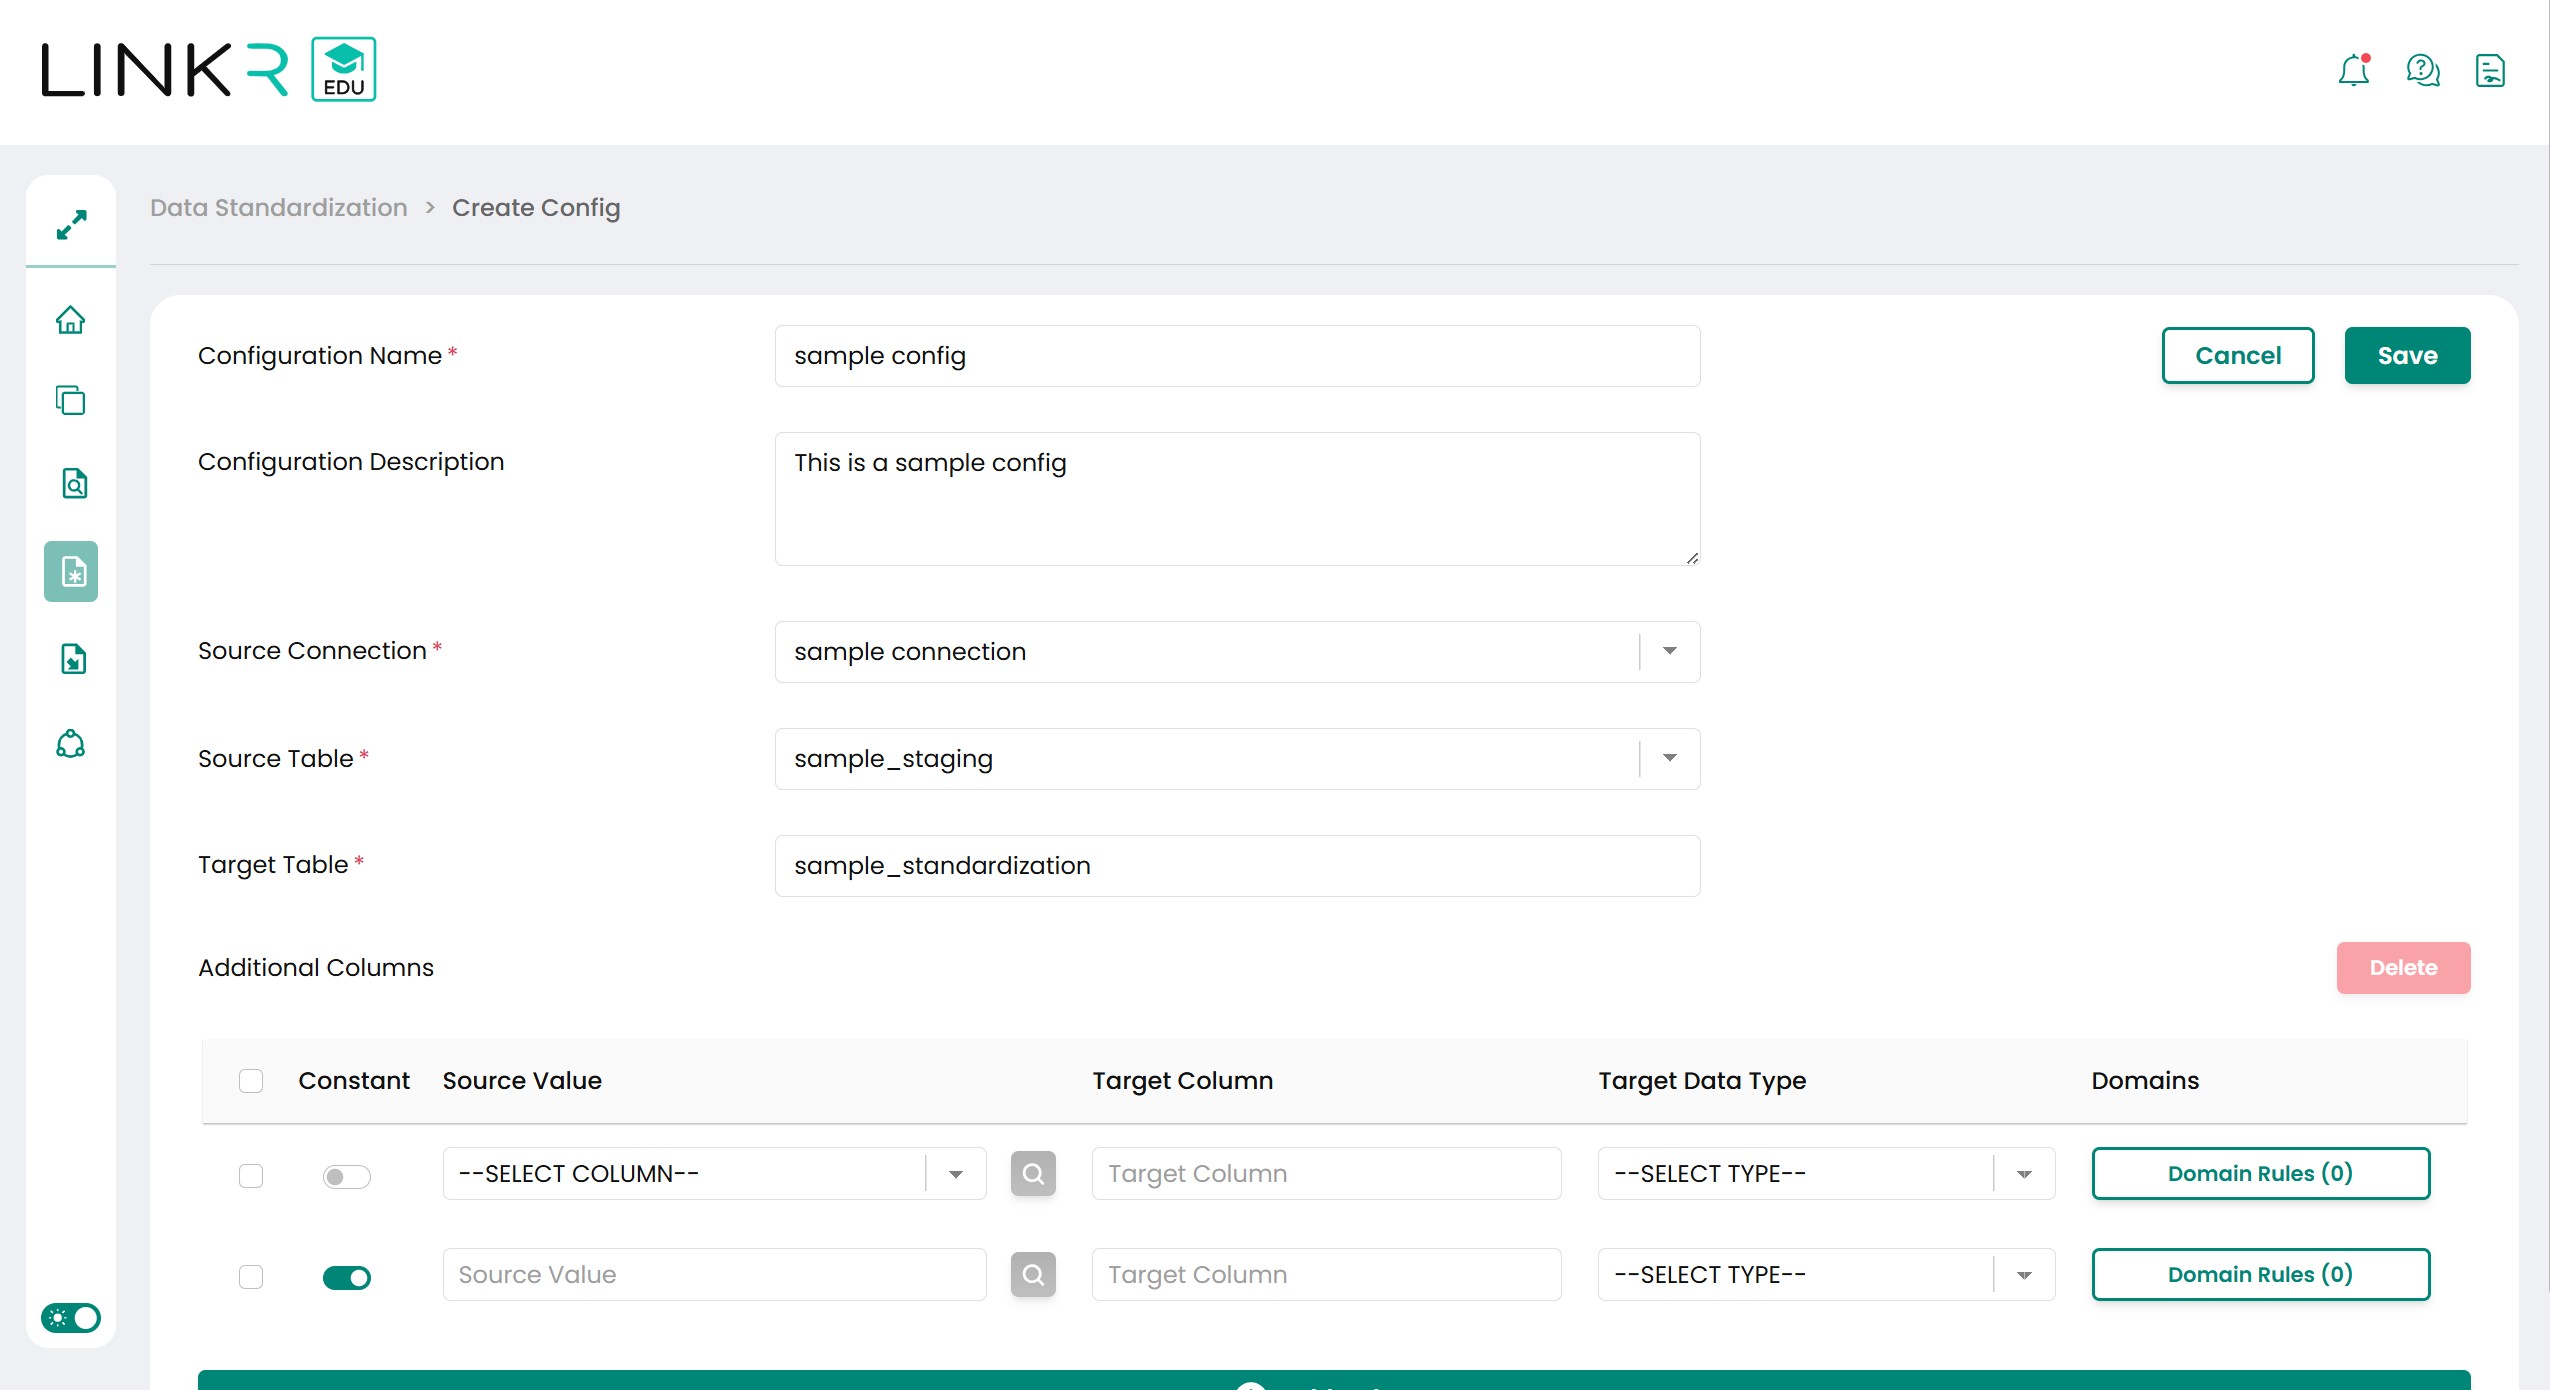
Explanation for each configuration is as follows:
Configuration Notes Configuration Name Configuration name as a label will be used to identify the config. Configuration name will be shown in the list of configurations. Configuration Description Contain short explanation of the configuration. This information will be shown in the config detail. Source Connection Dropdown list of connections to be used to populate the source tables list. Source Table Dropdown which can be used after choosing the source connection. Used as base table for standardization process. Target Table Contain table name to be created in the standardization process. Target table cannot be the same of source table. The process will delete and create the target table.
It is recommended that the target table in each config have different values because there will only be the last process results.
Additional Columns Add new column to the target table. Has 2 input variations, constant checked and unchecked. If the constant is checked then the input will be static value (This column will be contains same value for all row). If unchecked then the input value will be from source column. Constant Toggle button for using static value or source column. Source Value Will be contain a textbox if constant toggle is checked. Dropdown column from source table when constant toggle is unchecked. Icon Magnifier Button to open summary information from profiling process of the source column. This button can be used if the source table has been used for Data Profiling.
Data Profiling information will be explained in Data Profiling chapter.
Target Column Textbox column to set name of new column to be added in the target table. Target Data Type Data type for target column in the target table. Domains Menu to set the standardization rule to be used for the column.
User can set multiple domains in one additional column. Domains will be used from first domain until last domain.
The list of domains that can be used will be explained in the Additional Features Chapter.
-
-
Run Standardization Process
Data Standardization Process can be run from configuration created and shown in list configuration in Data Standardization page. Status column will be containing progress bar when the process is running, it will be containing checklist when the process is finished.
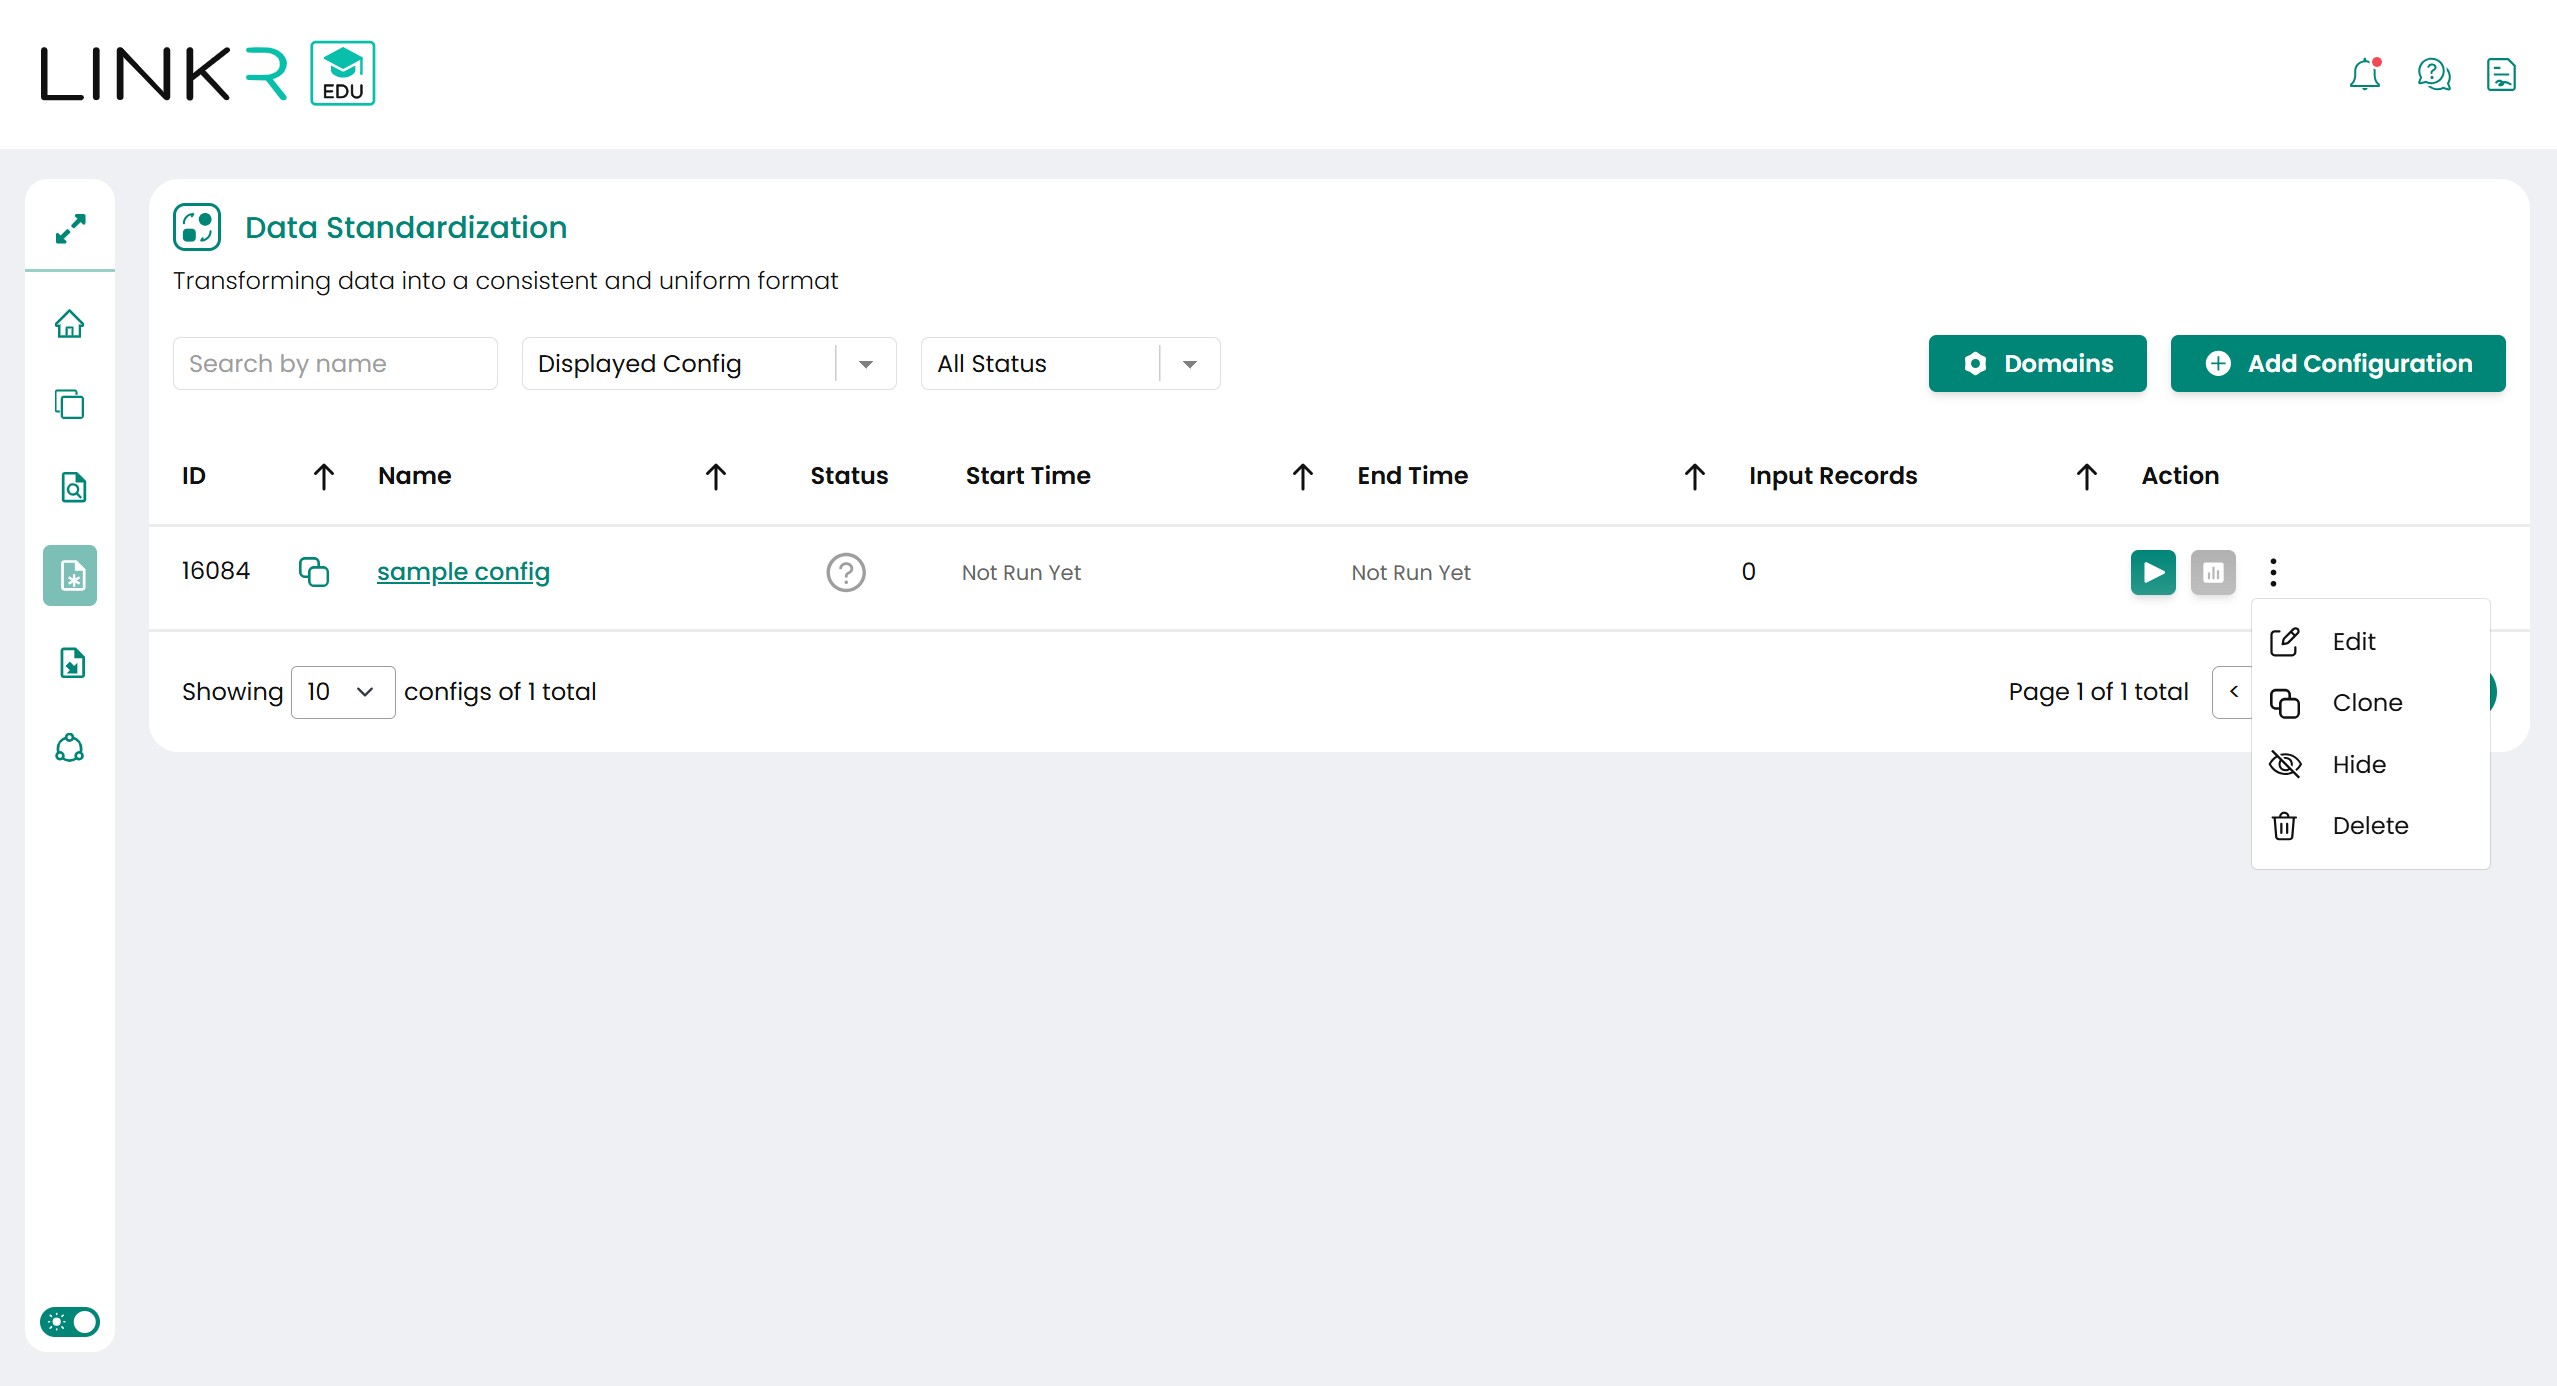
The Buttons function in Action column are:
Configuration Notes Run Config Start the process of the configuration. Summary Button to open the summary page of certain configuration. Contain percentage and additional columns (not constant) in the target table. Edit Open configuration page to see or update the configuration. Hide / Show Hide configurations so that they are not visible on the home page or vice versa. Delete Delete config and component related to the configuration. -
Output Standardization Summary
Standardization Summary page has information about the data row number and duration used for the process. For each of additional column (not constant) will have summary information of the change applied to the column. When the column name is clicked, it will open pop up preview of value in the column.
Summary result of standardization process has 2 view variations, Card view and Table view. Example of summary page depend on the view is like as below picture:
Card View Summary Data Standardization
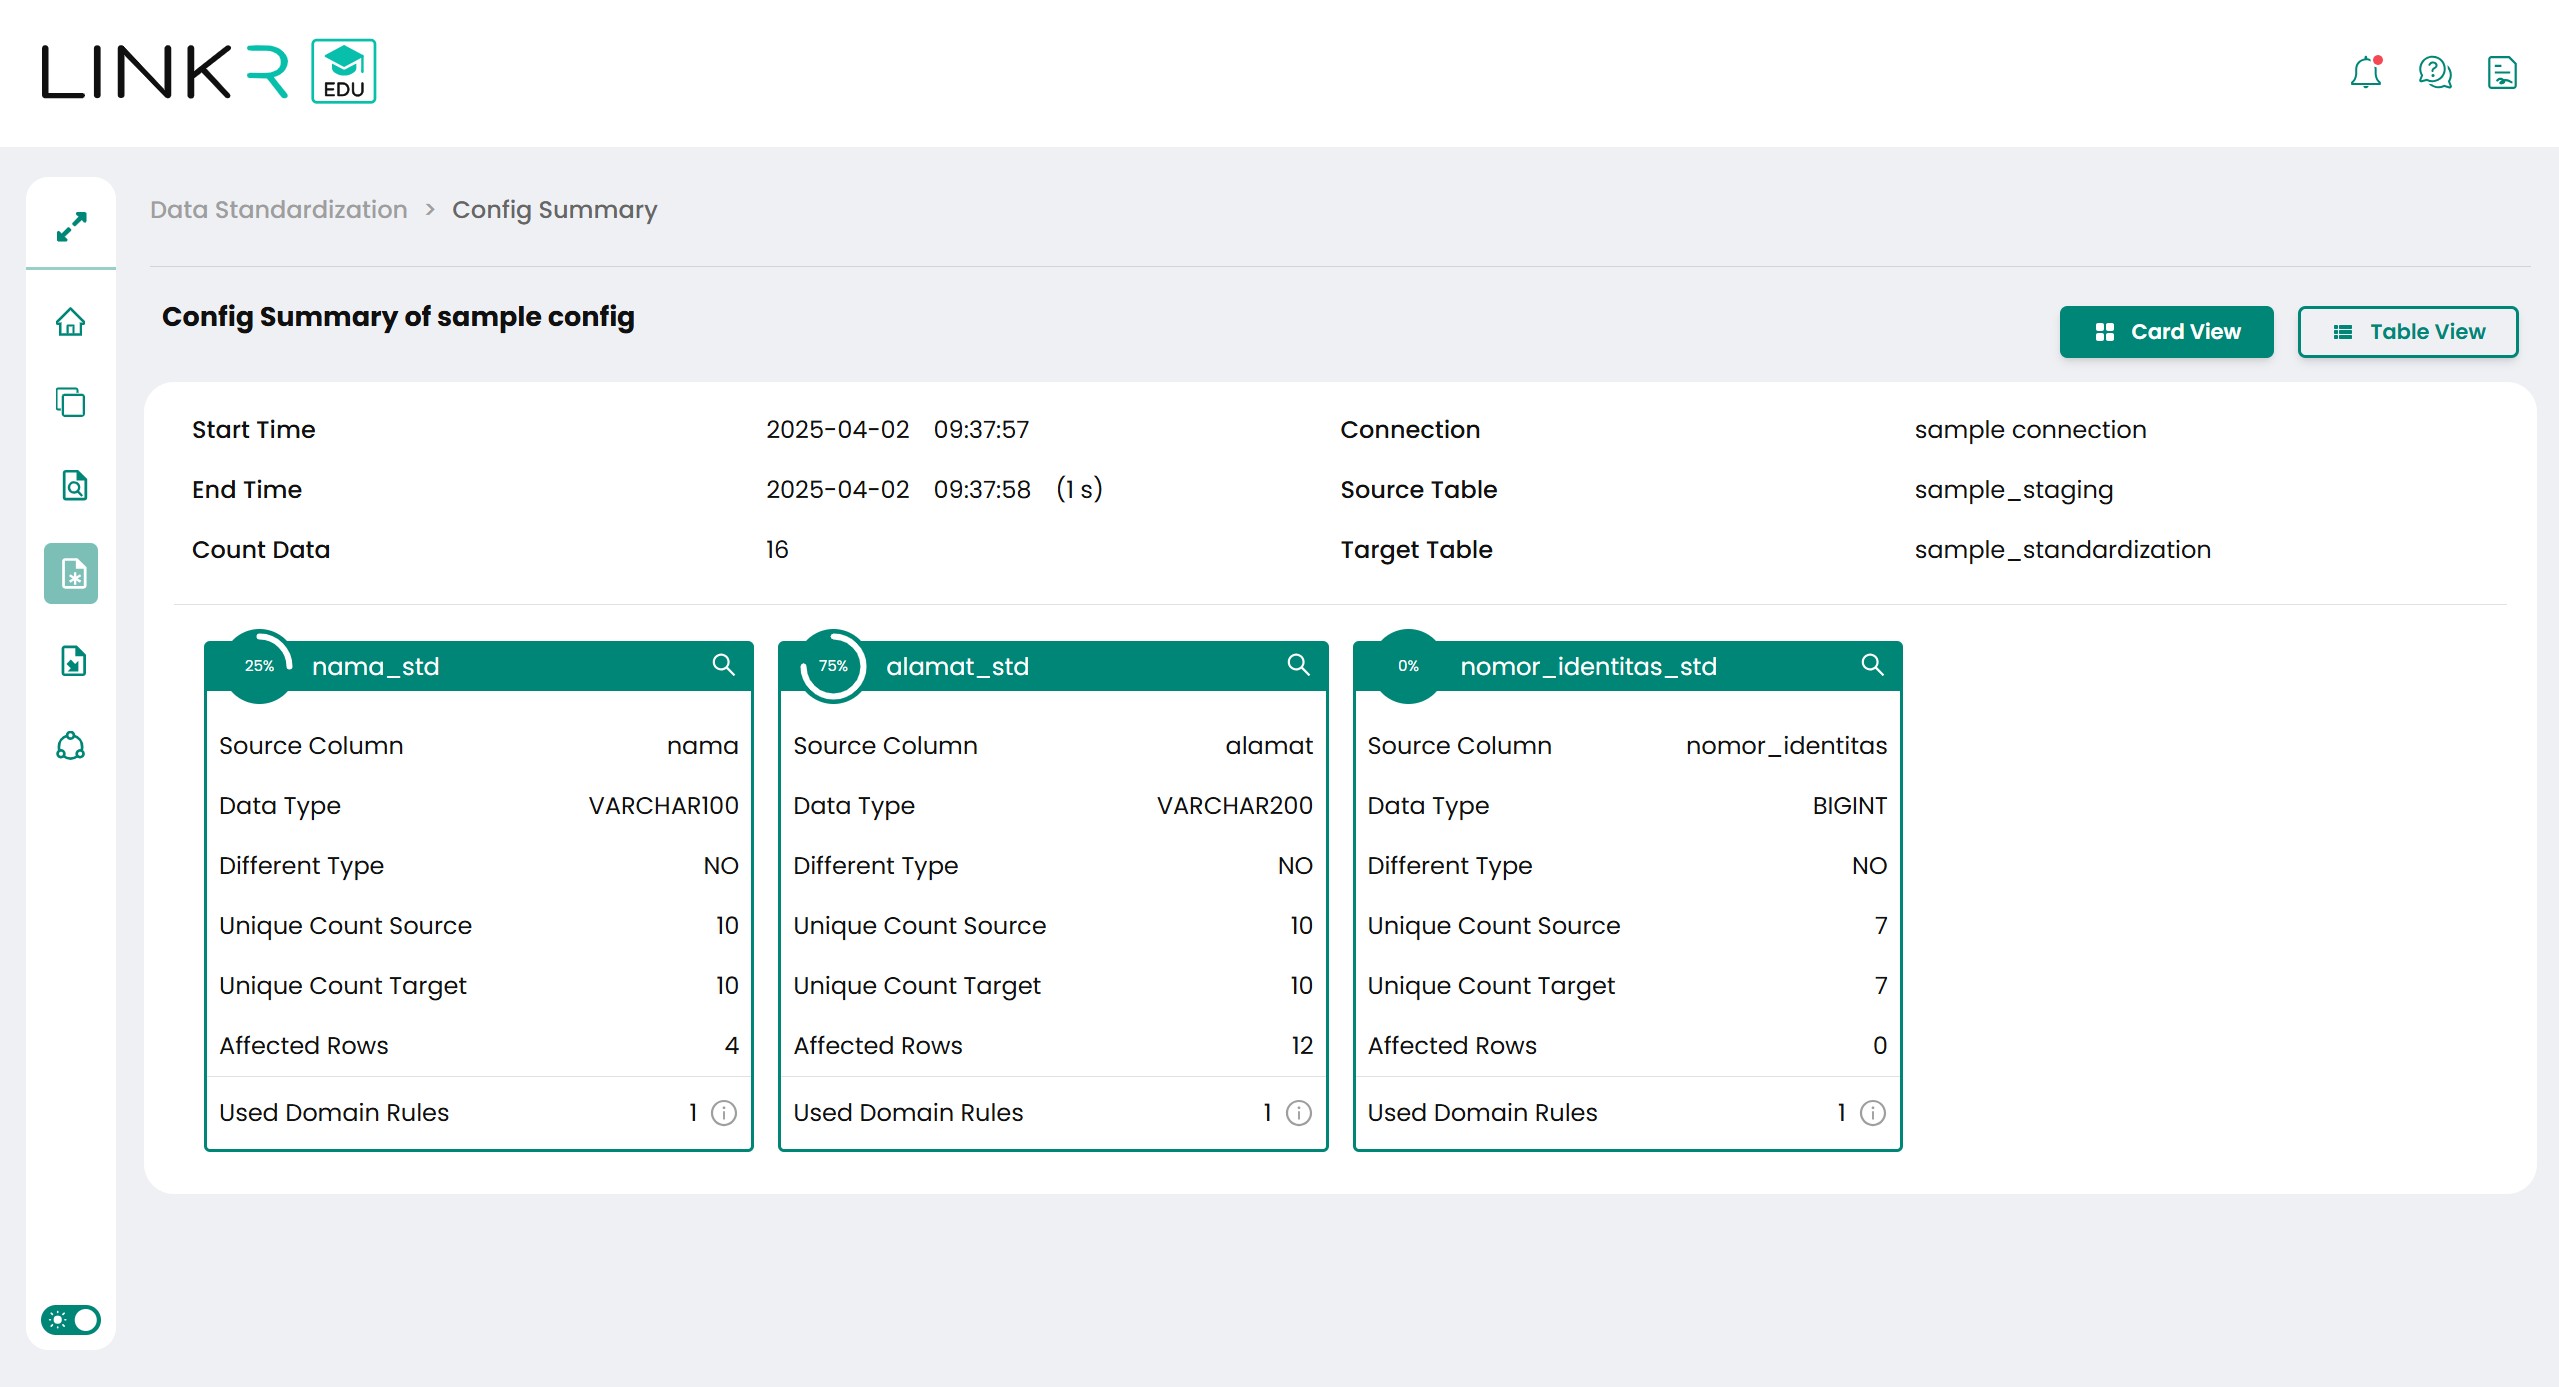
Table View Summary Data Standardization
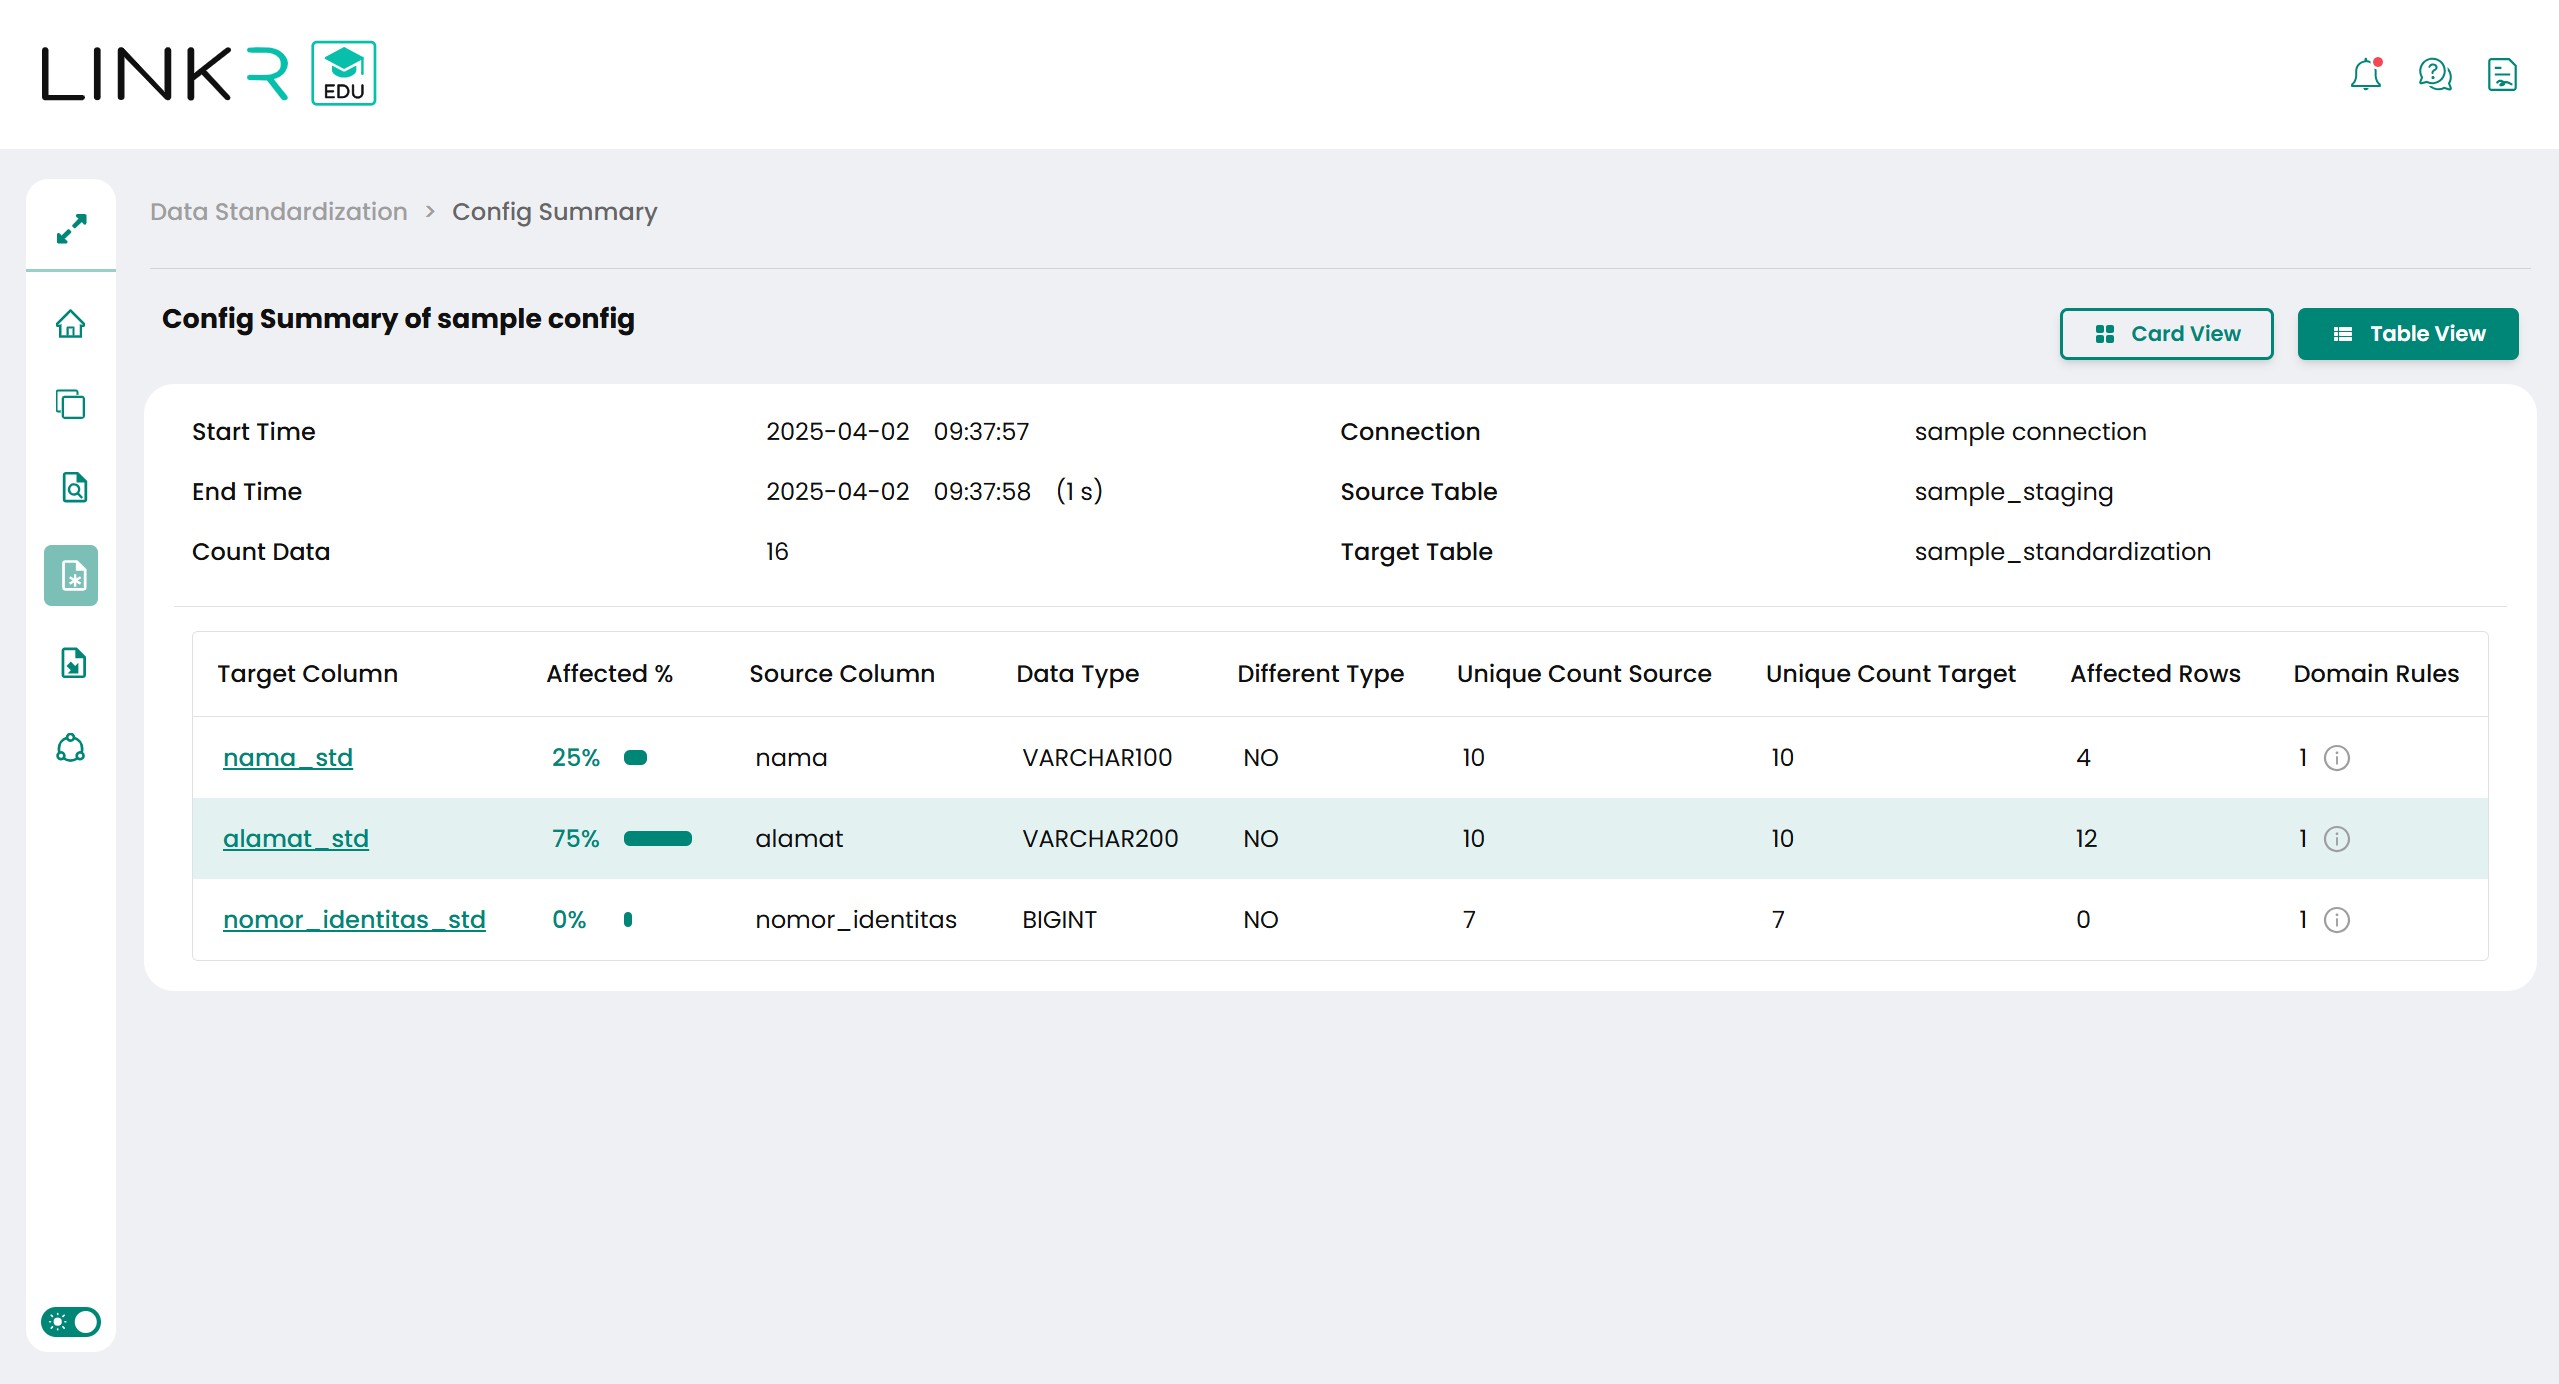
Explanation for the summary values in the page is:
Configuration Notes Count Data Row data number in source table. Target Column Additional column name in target table. Affected % Percentage of value in the column affected by the domain rules compared to the number in count data. Source Column Input column name used for target column. Data Type Data type of taget column. Different Tye Value Yes means source column and target column has different data data type and vice versa. Unique Count Source Number of value variations in source column. Unique Count Target Number of value variations in target column. Used to show the difference of value variations before and after standardization process. Affected Rows Number of values updated because of the standardization rules in the domain. Domain Rules Information of domain used in the additional column.
-
-
Data Profiling
-
Create Data Profiling Configuration
Data Profiling functions to identify data patterns in all columns of a table. The steps for using the data profiling menu are as follows:
-
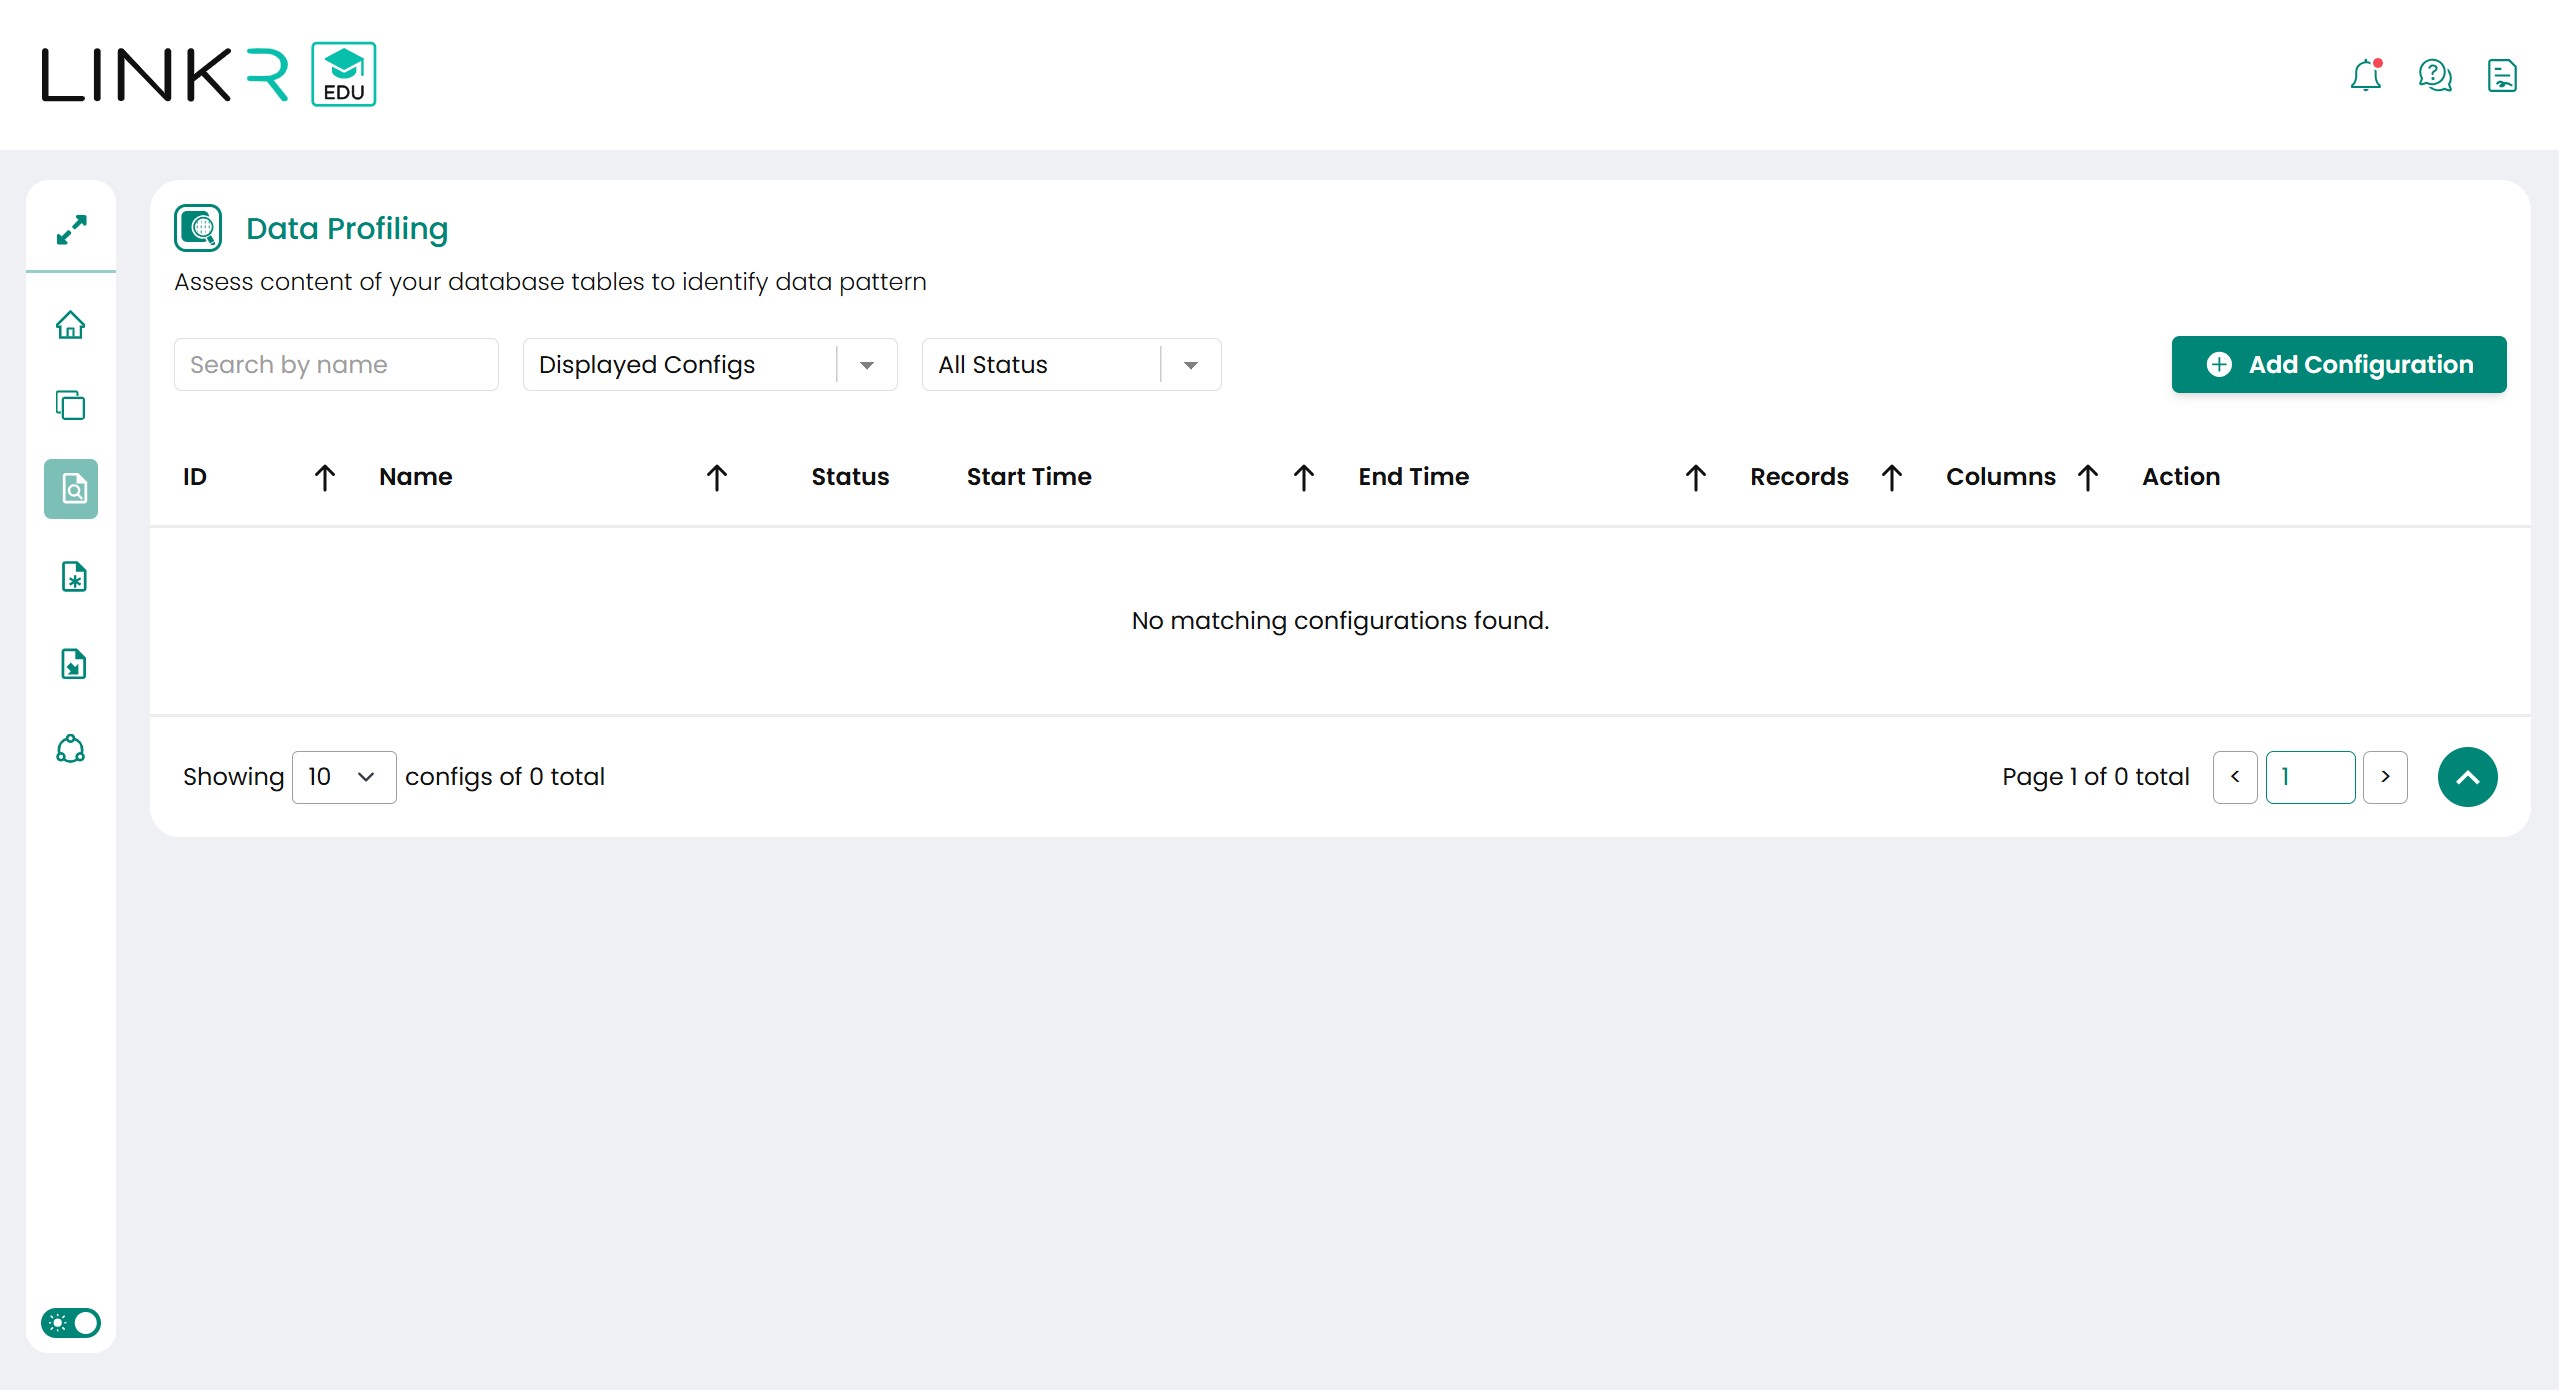
Select the Data Profiling menu, the page will display a list of configurations that have been created and run. Press the Add Configuration button to create a new configuration.
-
The next step is form the profiling configuration as needed. An example of the initial configuration display, as shown below:

-
Select the Source Connection dropdown to fill in the Source Schema dropdown. Then select the Source Schema dropdown to display the Source Table dropdown. For the target configuration there is only a Target Connection, when in the process the results of the profiling will be formed automatically on the Target Connection. When finished press the Save button.
-
-
Run Profiling Process
The profiling process can be run by pressing the run button in the configuration list as shown below. Same as in the Data Staging menu. The status in the configuration list will change according to the process conditions. Status will be worth success if the process is complete, then the summary button can be pressed.
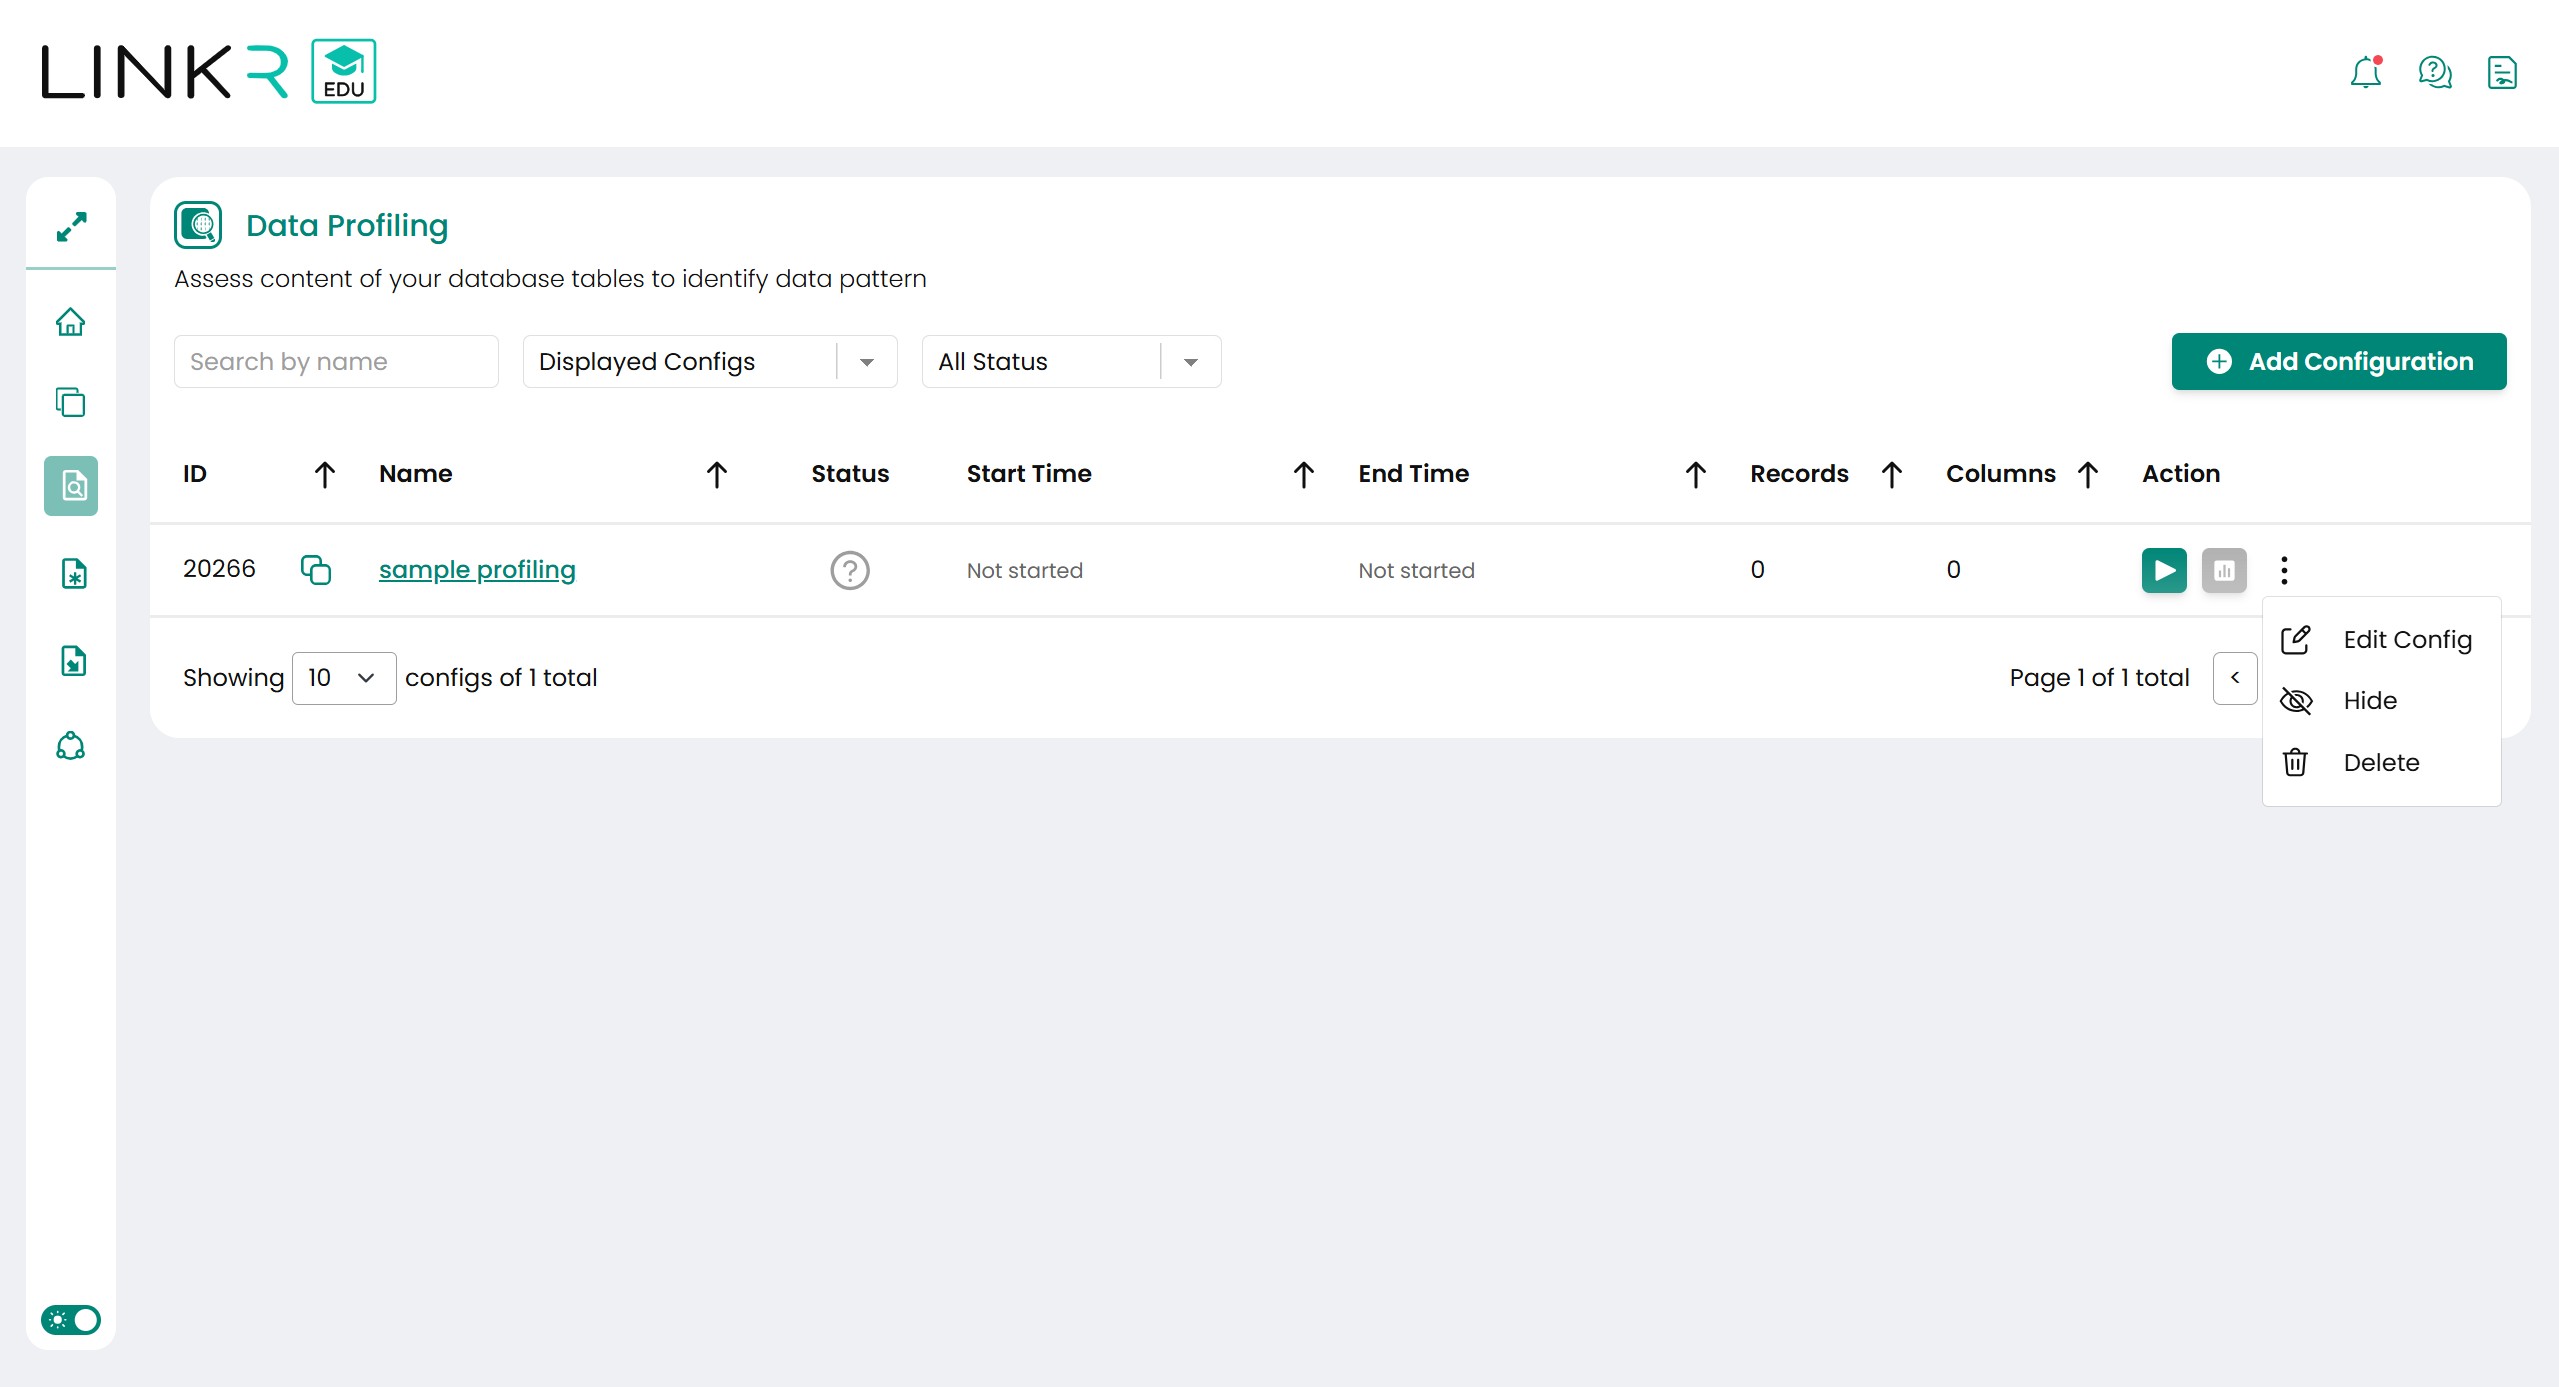
The functions of the buttons in the Action column are as follows:
Button Notes Run Run the profiling process. Summary Move to the summary page containing statistical information and patterns for each column of the run results. Edit Config Move to the configuration page to view or change configurations. Hide / Show Hide configurations so that they are not visible and taken into account on the home page or vice versa. Delete Delete configurations and components associated with those configurations. But doesn't delete table trx_profilr_log and trx_profilr_summary in target connection. -
Output Profling Summary
The profiling summary page has information on the number of columns and rows along with the time needed to carry out the process. In addition, there is information on the uniqueness of the data and the patterns of each existing column. The summary page display is as shown below:
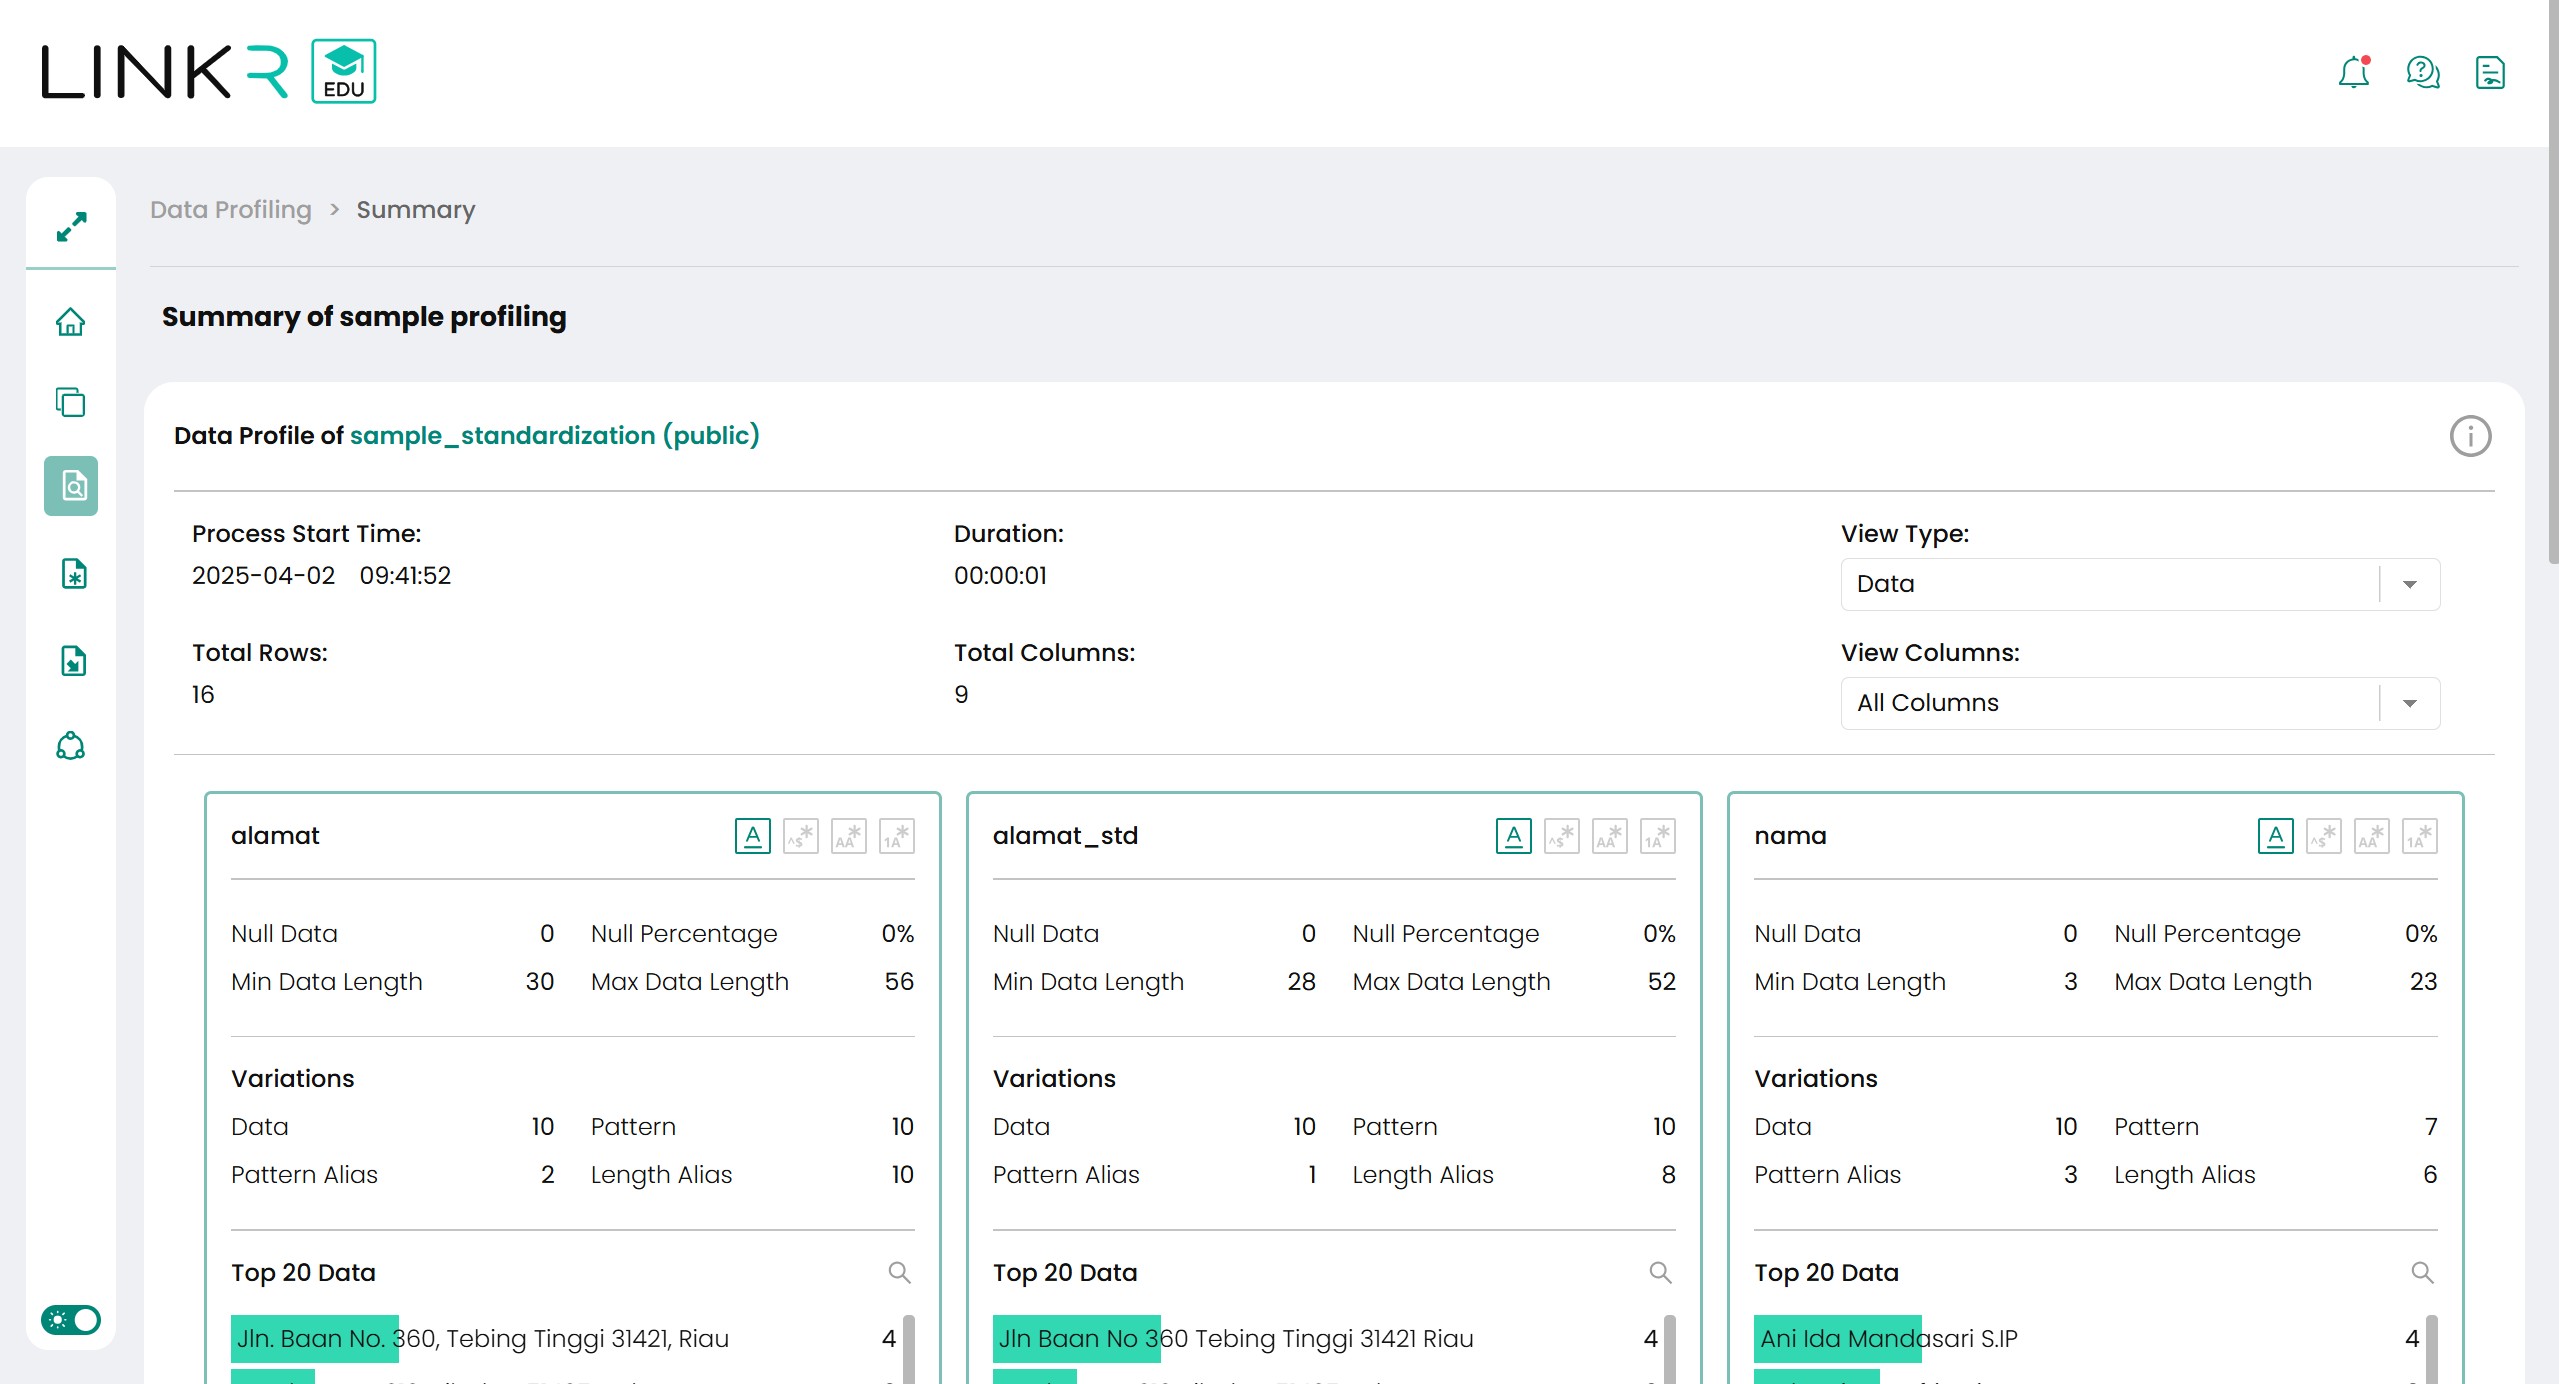
In the summary information of each column has 4 types of View Type. The View Type can be changed using the dropdown on the top right or using the 4 icons in each column. Explanation of variations and views for each of these views from left to right is as follows:
View Type Notes Data The uniqueness of the data in that column. Pattern Regex pattern of each data contained in that column. Pattern Alias Names and other groups of display patterns. Pattern Length Alias Same as Pattern Alias but looking at the length of the data.
-
-
Data Deduplication
-
Create Data Deduplication Configuration
In Data deduplication, data divided into two types, Reference Data and Compare Data. Data reference is golden/master record of a group of duplicate data. Data compare is the detected data that has same or similar information as the golden record.
Database connection created from previous step can be used for this step. Step to create deduplication configuration is:
-
Go to Data Deduplication menu, this page will show all deduplication configuration owned or share to this user. Press Add Configuration button to create new configuration.
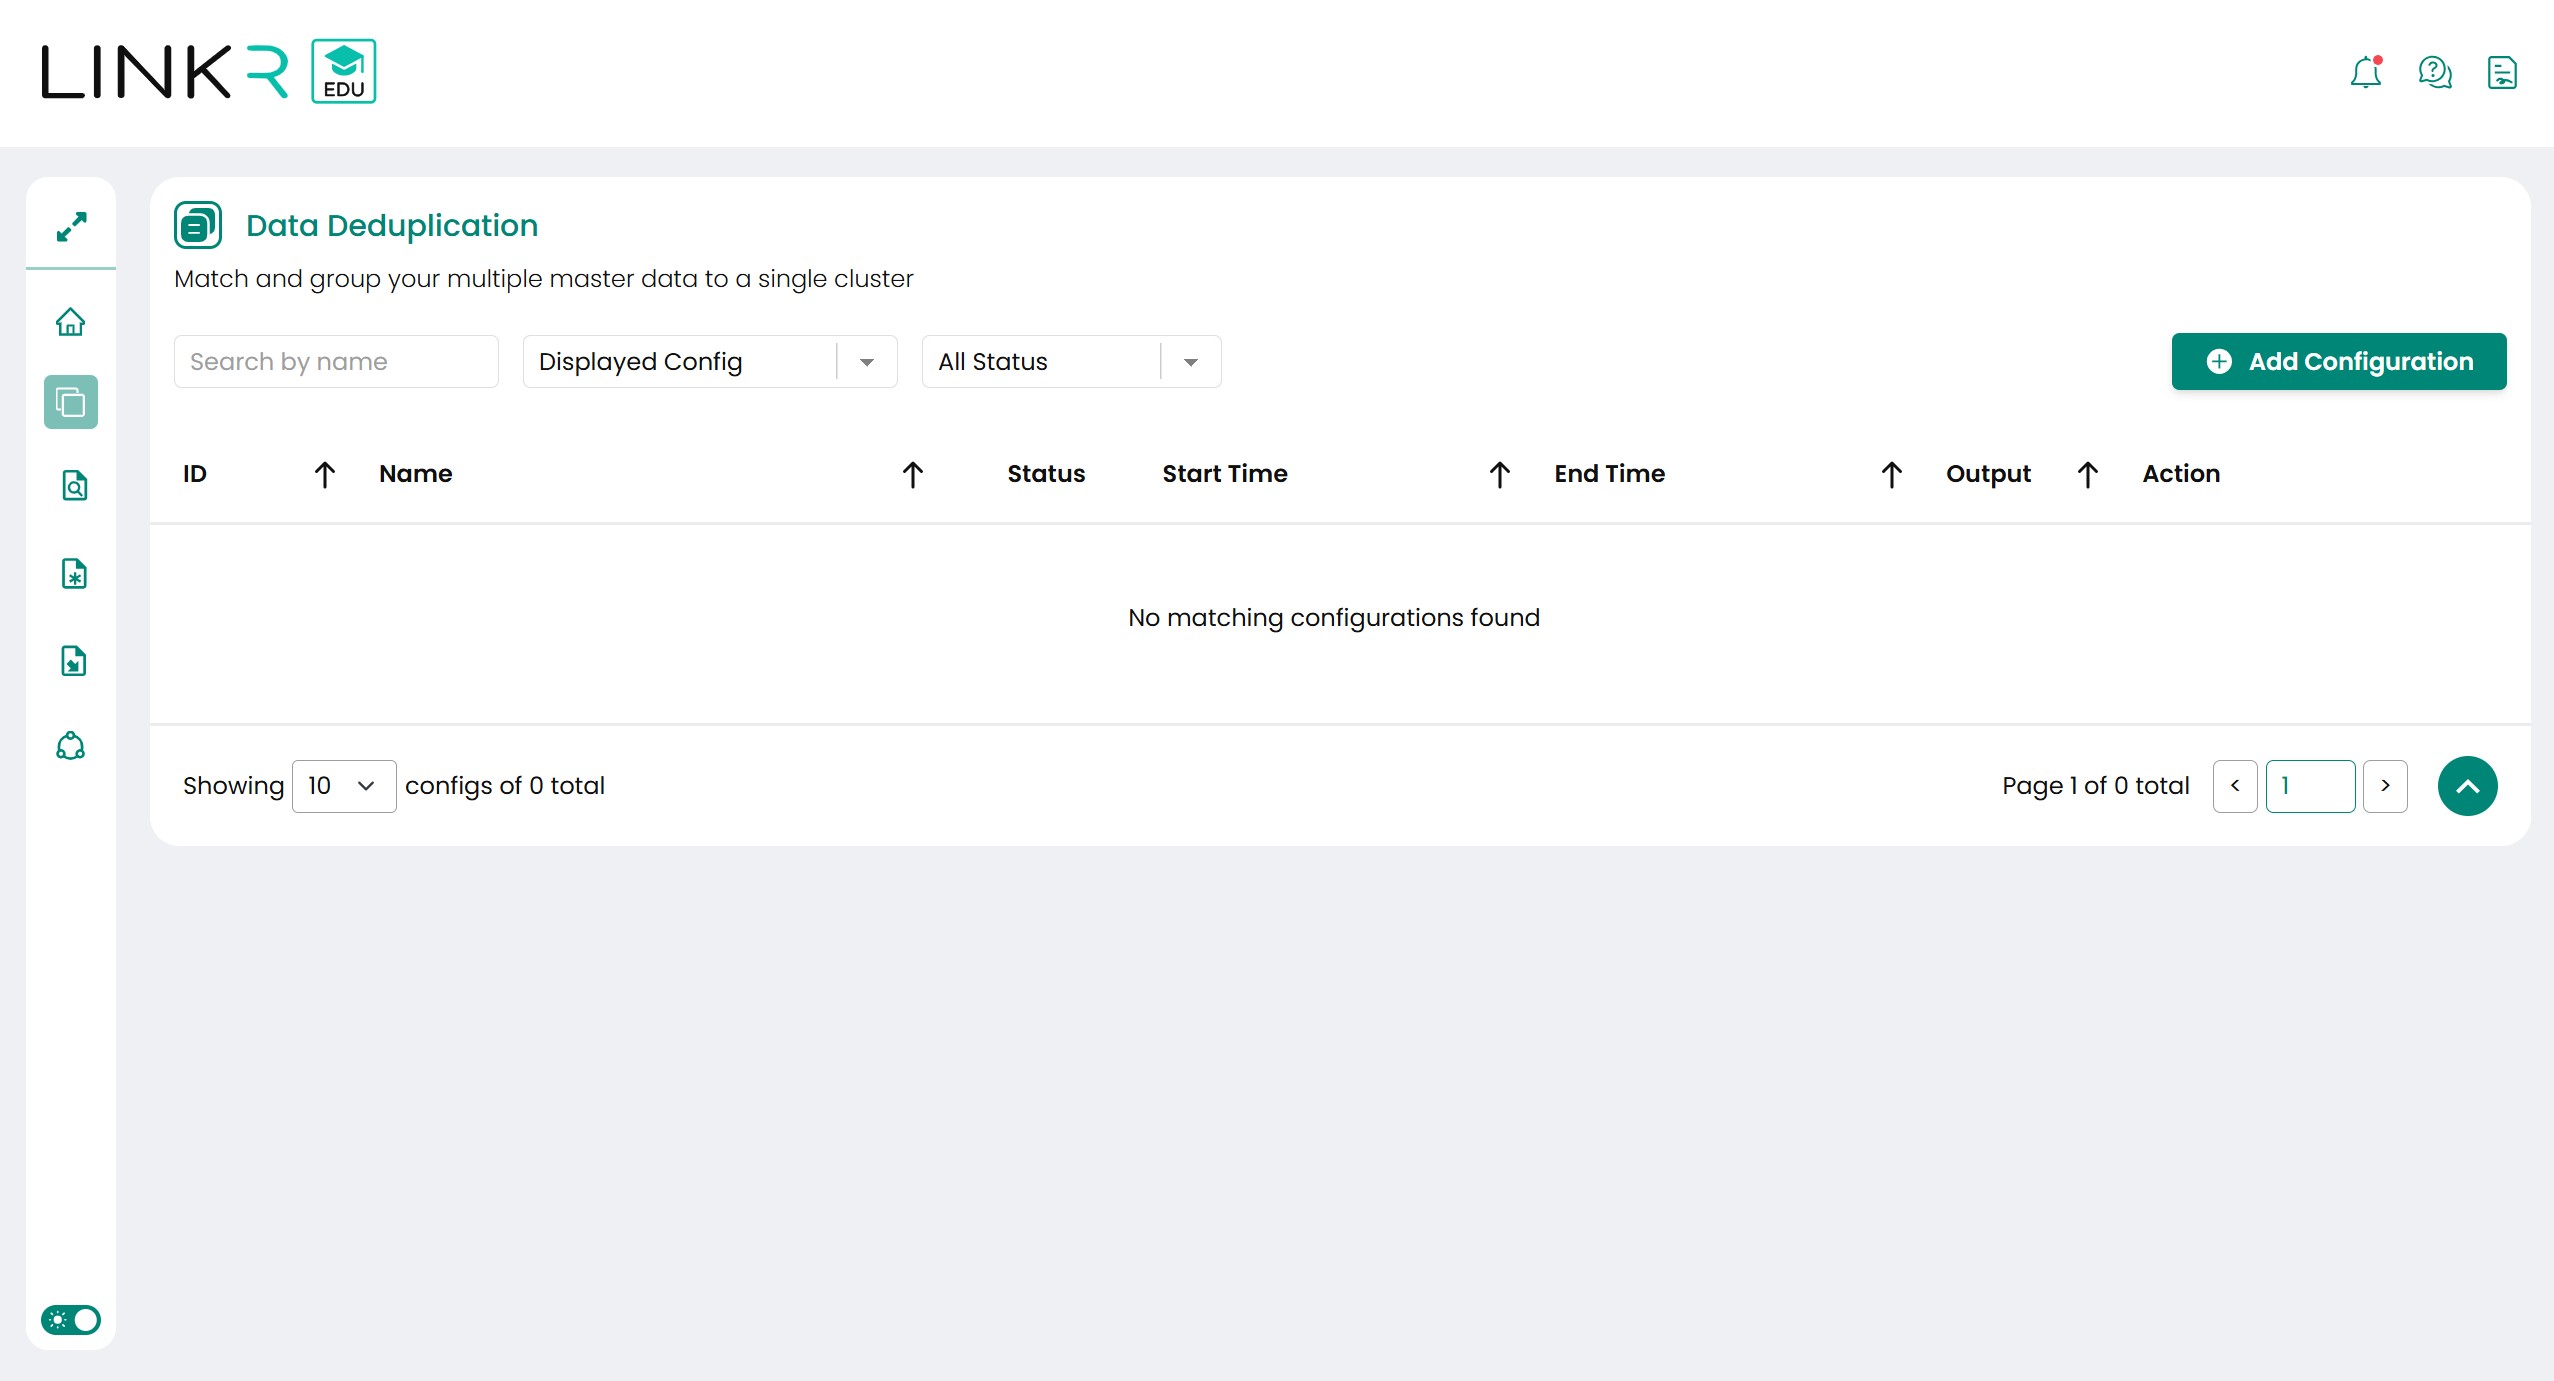
-
The next step is form the deduplication configuration as needed. An example of the initial configuration display, as shown below:
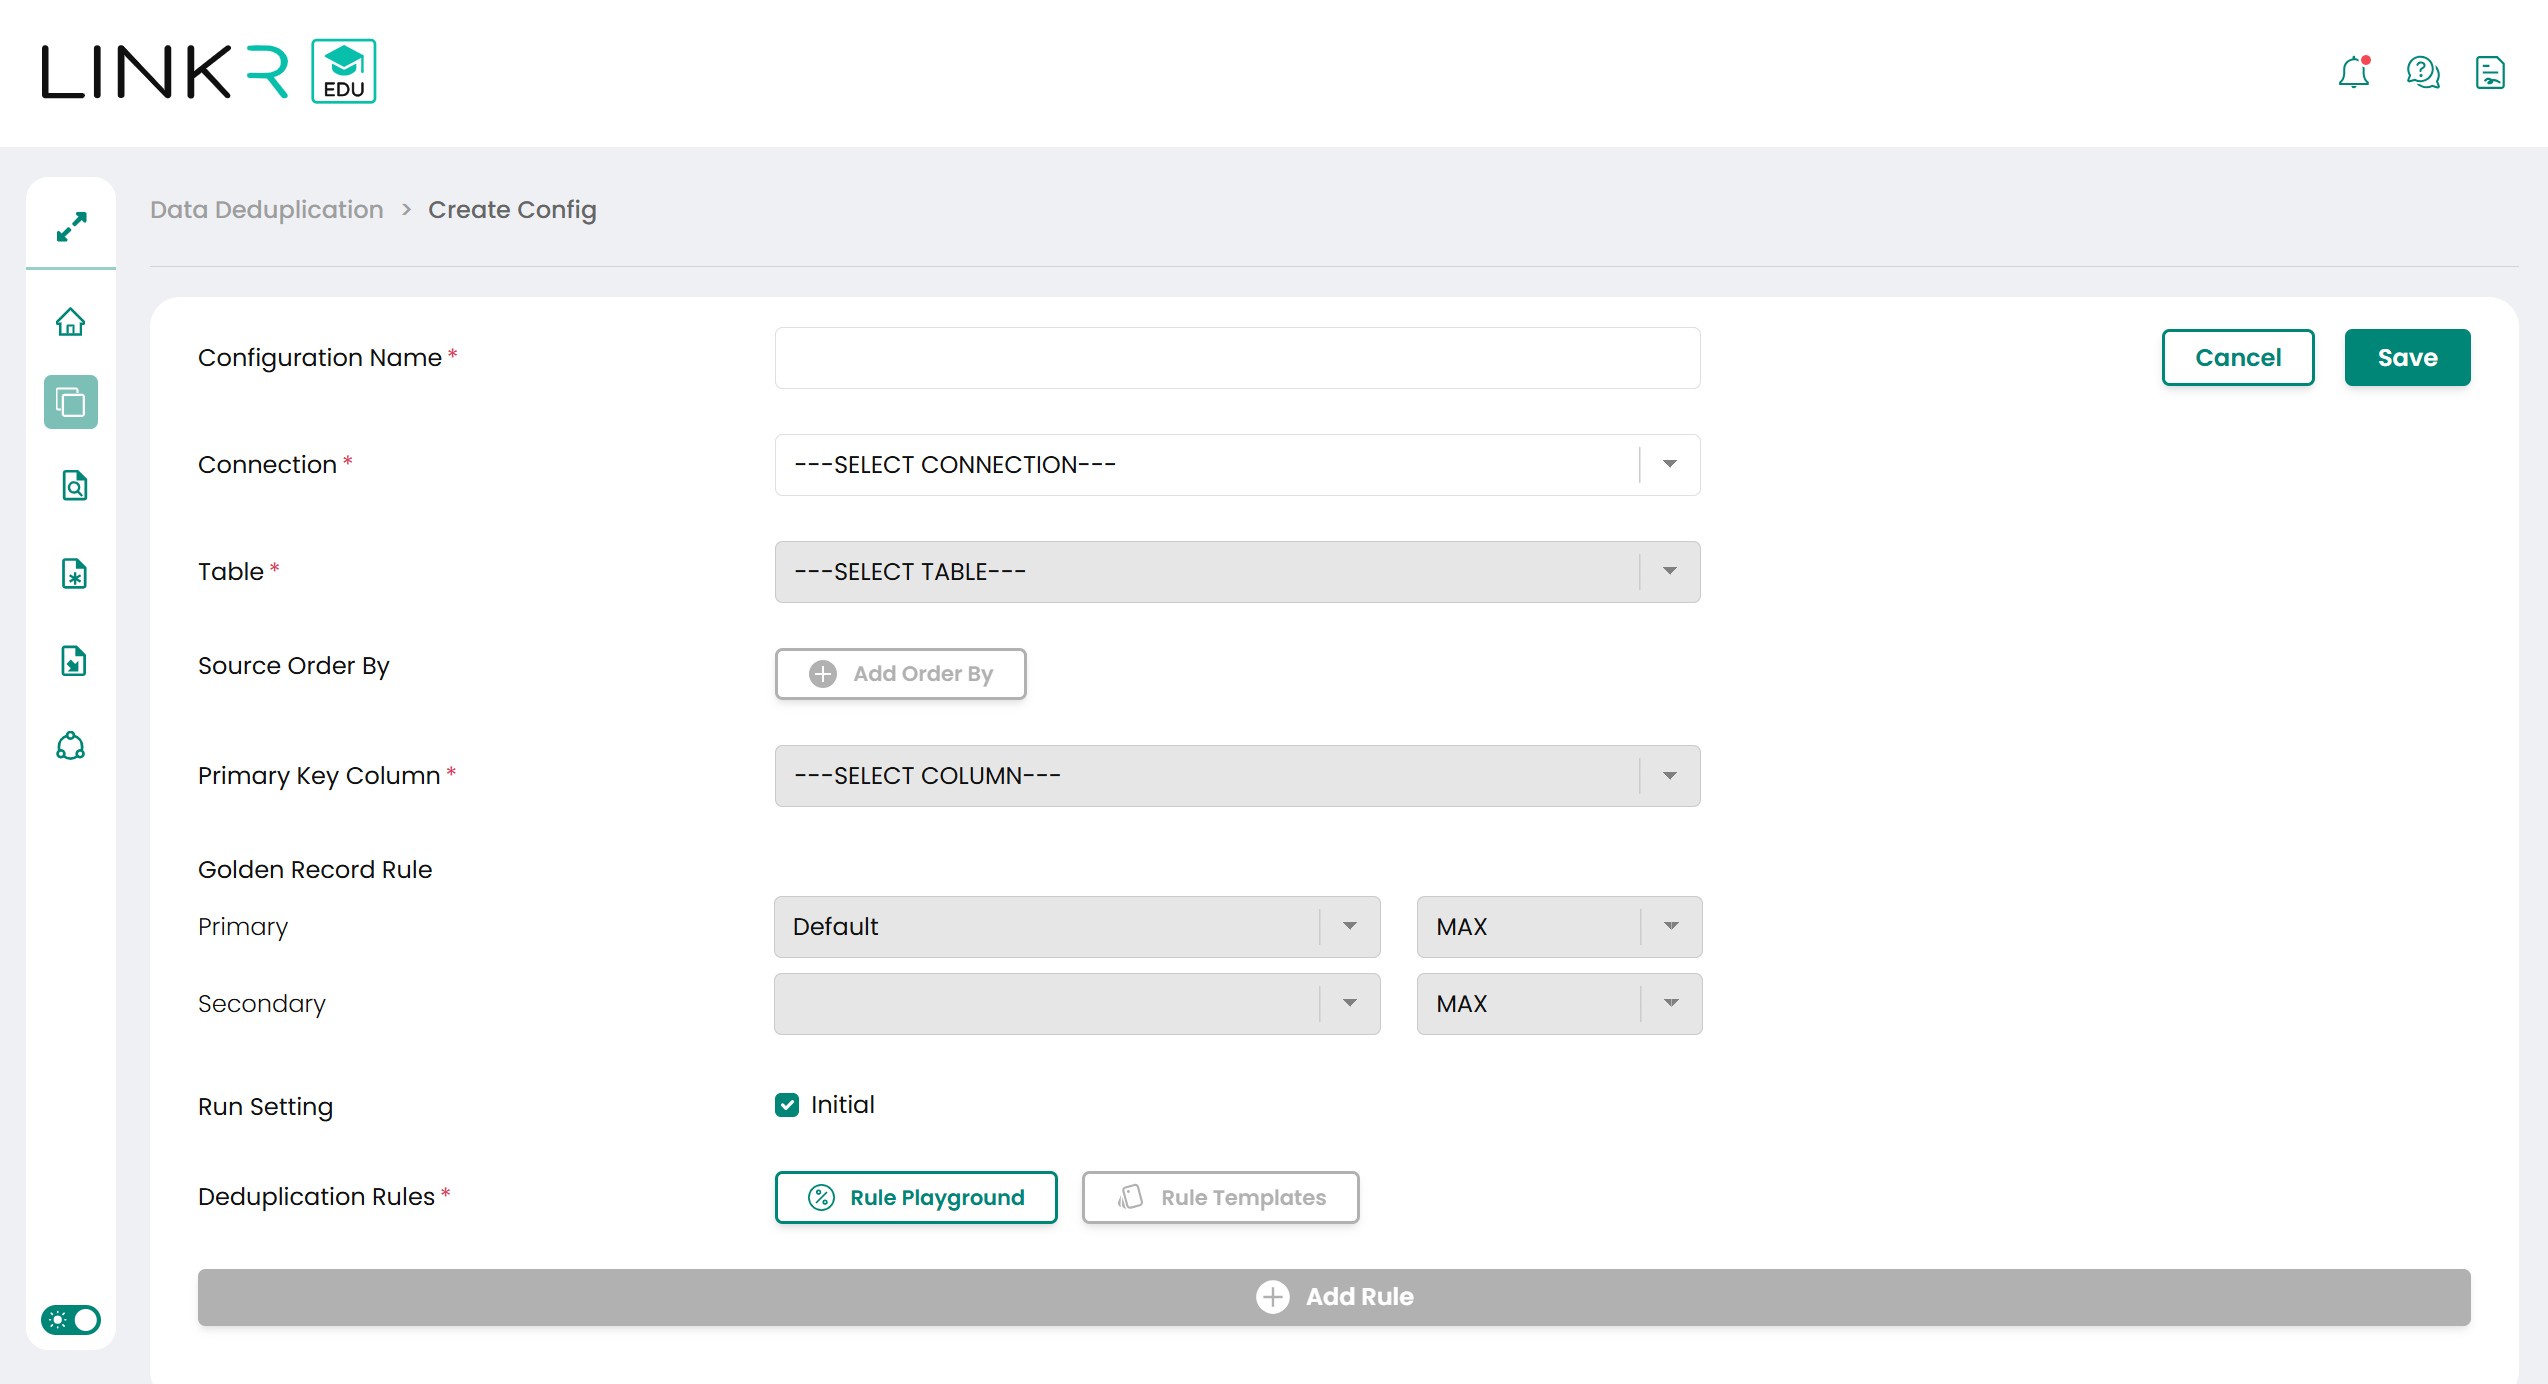
-
Choose dropdown connection to fill the table dropdown. Choose the table used for deduplication. It will fill the column list dropdown and you can press the Add Rule button to specify the deduplication columns.
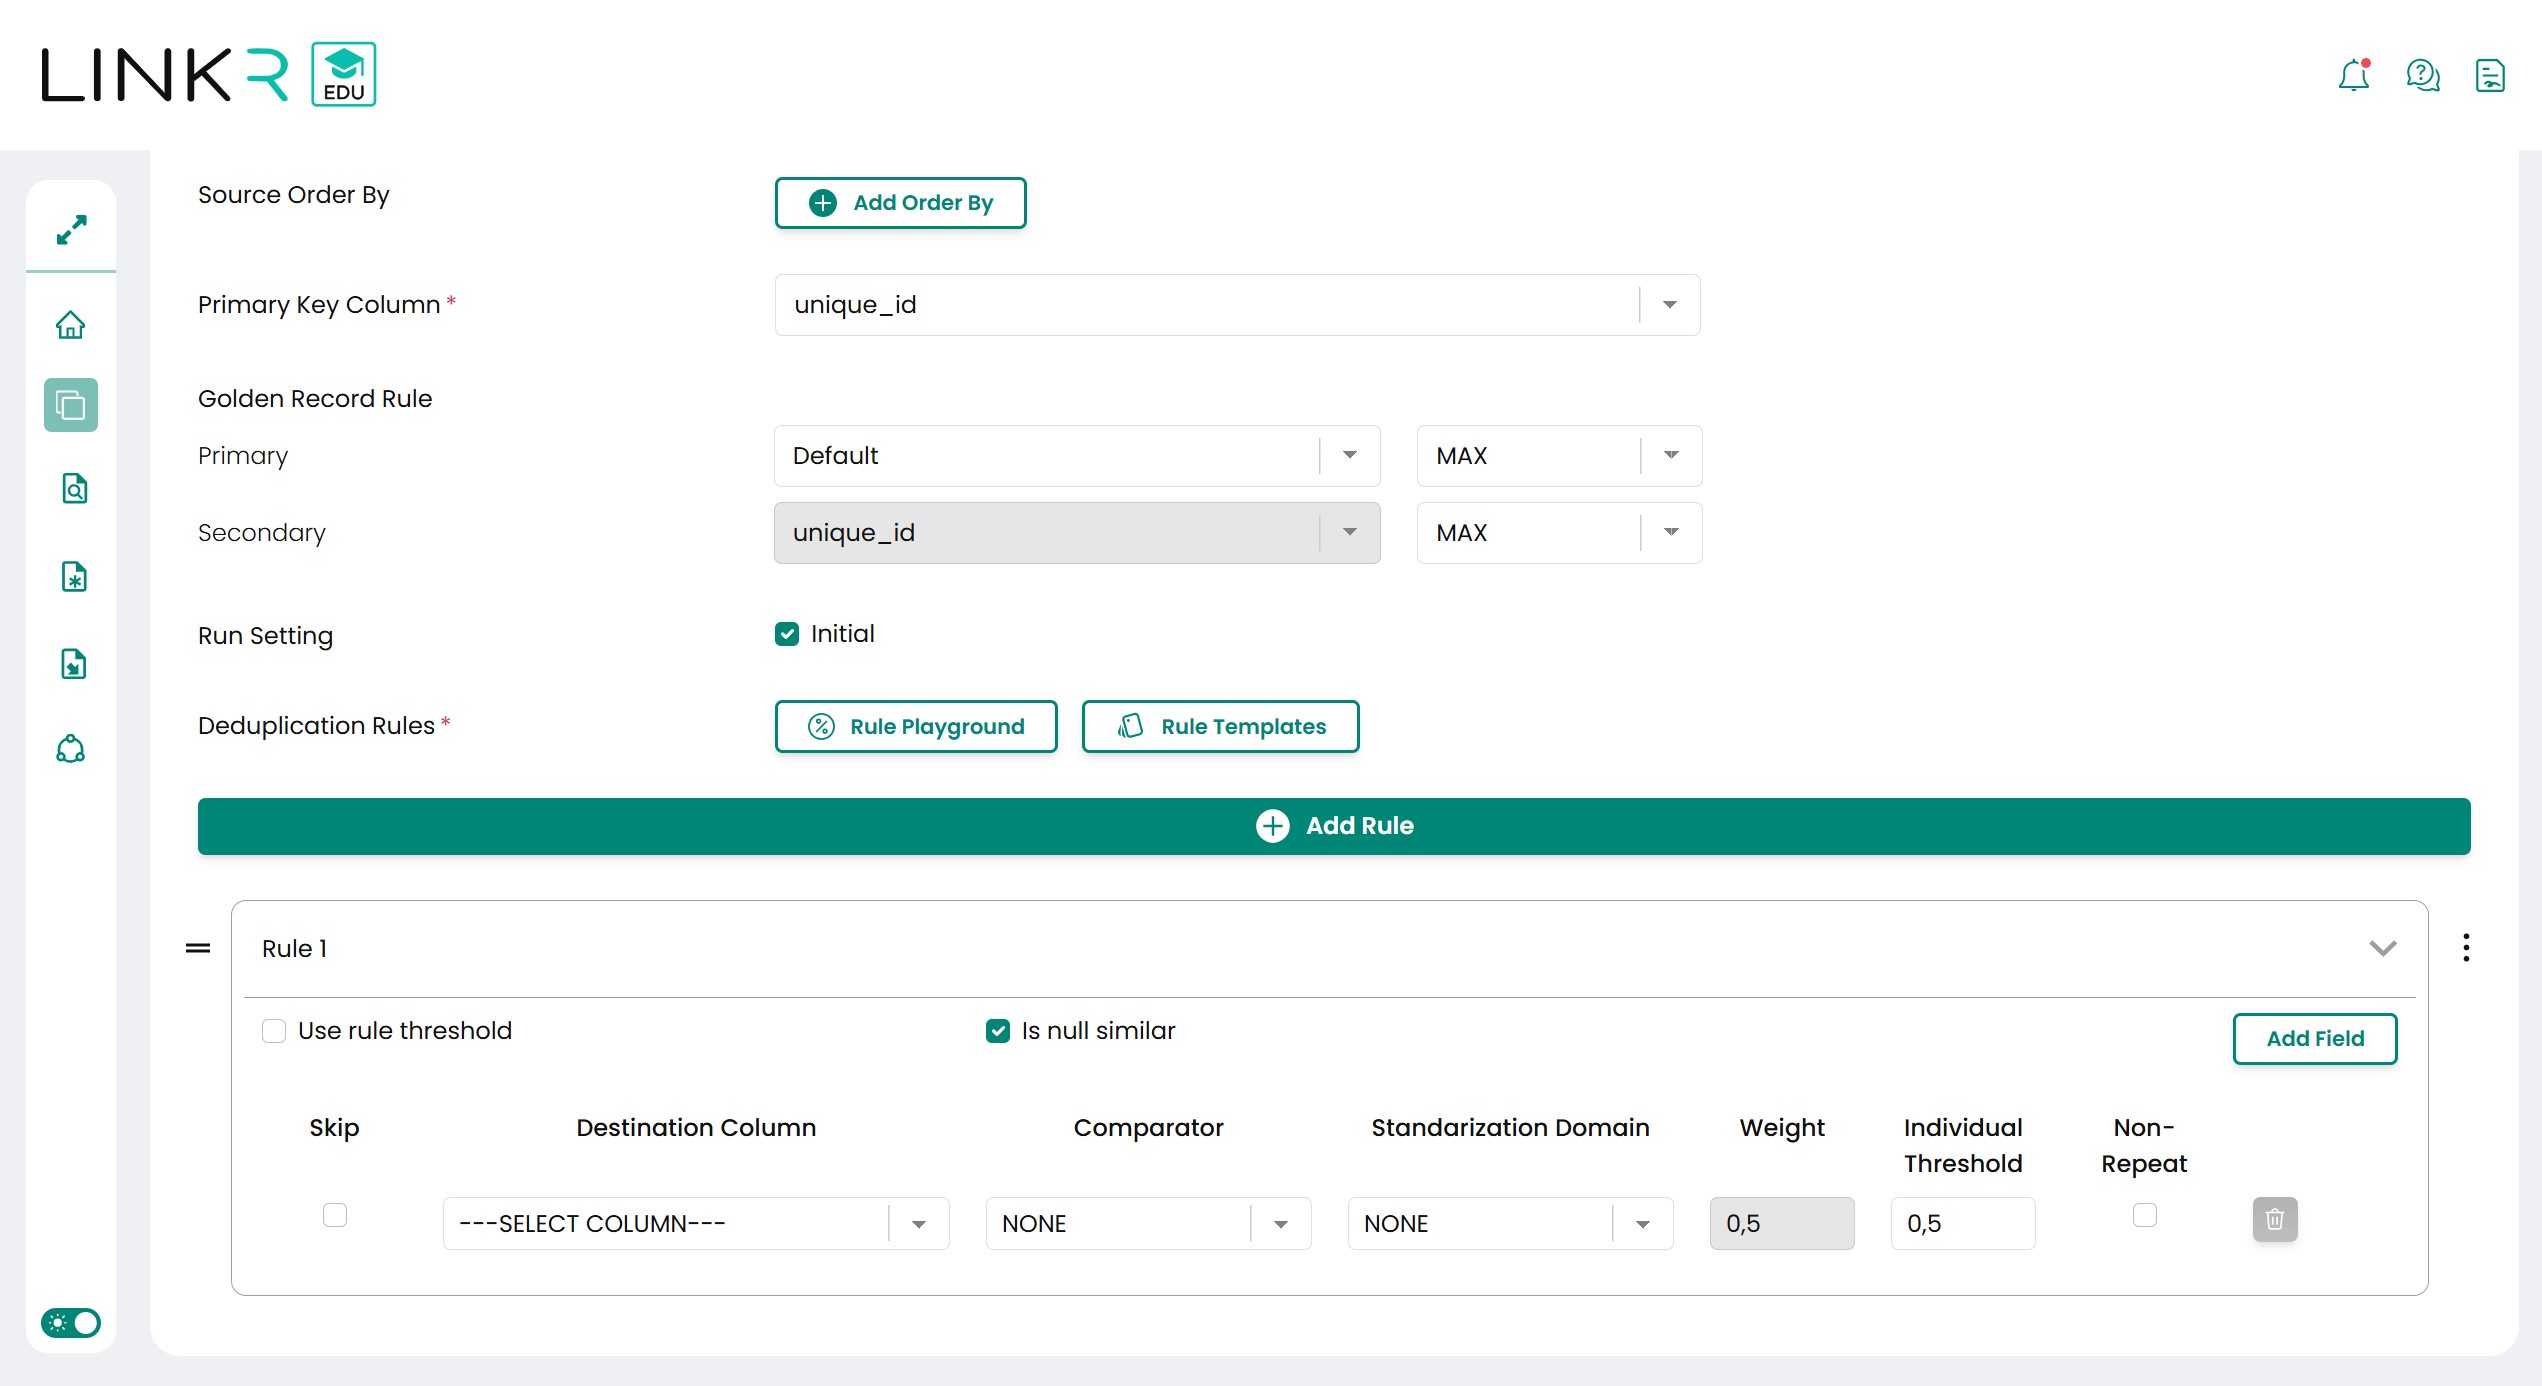
-
Explanation for the upper setting is:
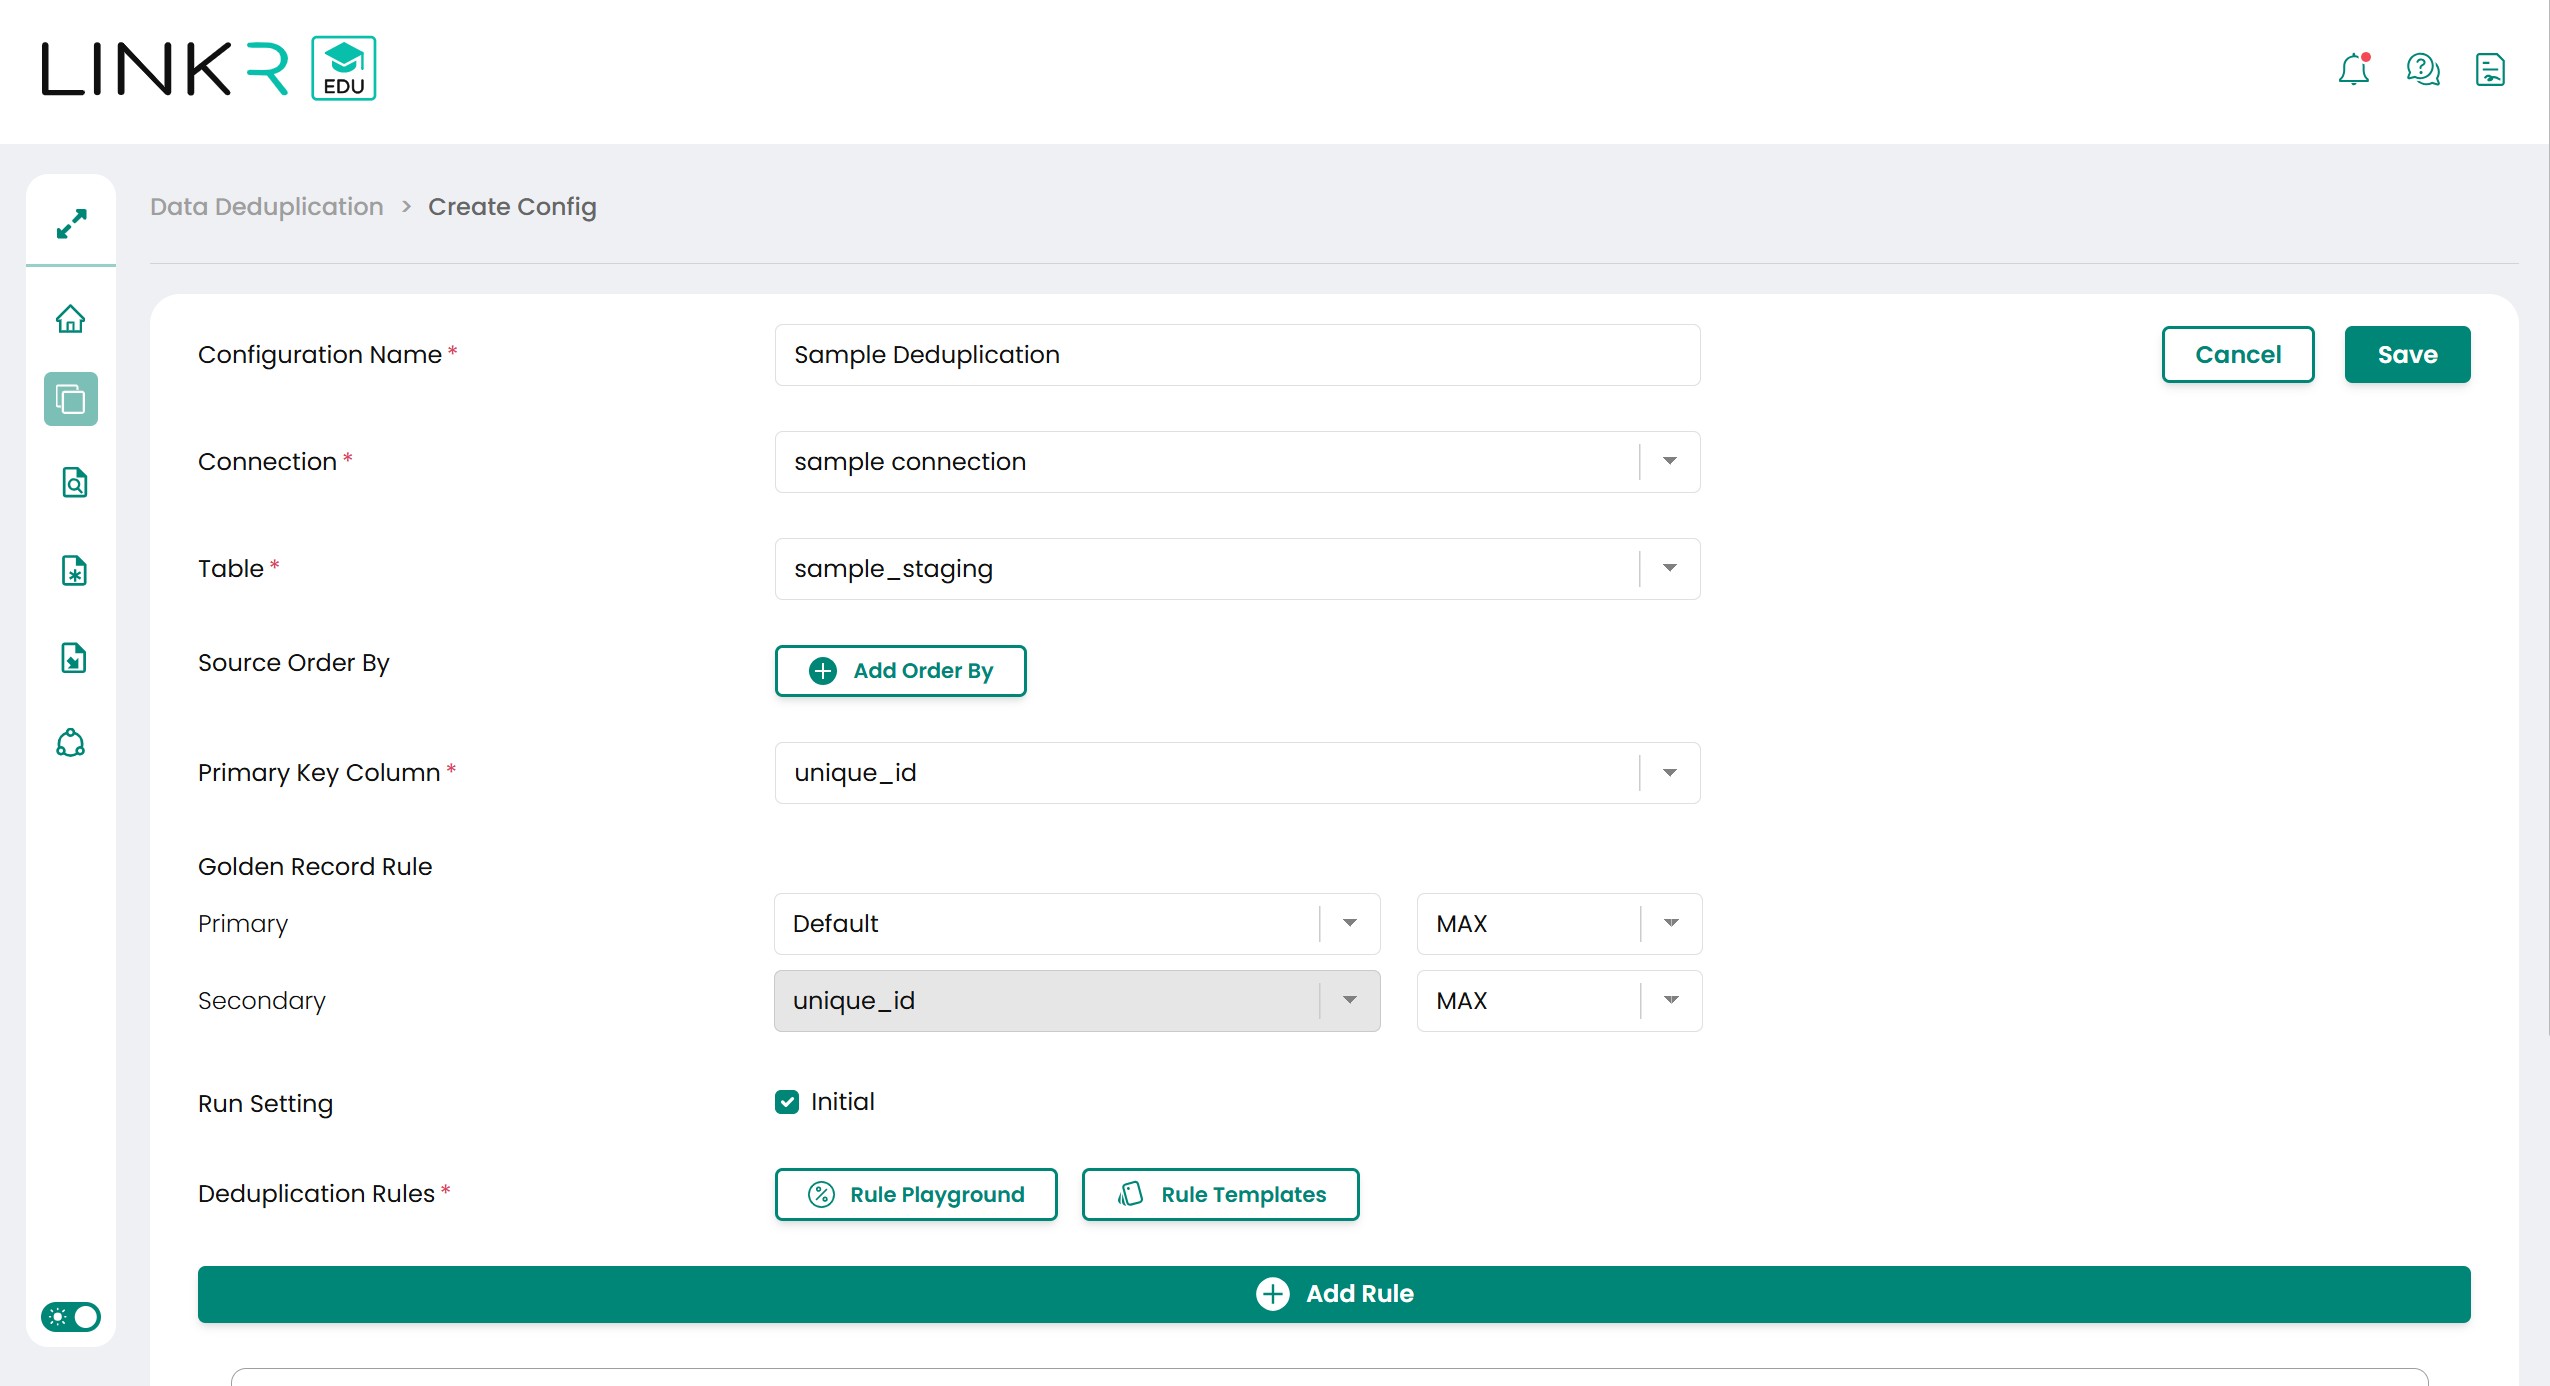
Configuration Notes Configuration Name Configuration name as a label will be used to identify the config. Configuration name does not have to be unique. Connection List of connections can be used for deduplication. List Connection same as the connection in Database Manager. Table List of tables in the chosen connection.
Tables can be used for deduplication process must follow these rules:- No linkr word at prefix of the table name
- No exact, reference, match, metric, master, stage, alter, state, history word at postfix of the table name
- Must Have a Primary Key column
- The data type in all columns can only be VARCHAR, INT, BIGINT, DATE, DATETIME, FLOAT, DECIMAL.
Source Order By Column and operator used to order the data before deduplication process. Columns used in this dropdown need to be inserted in the rule.
If the columns not used for deduplication. Set it to 0 value weight or threshold and tick the Skip setting.
ID Column Column dropdown to set the primary key column. Golden Record Rule Dropdown to determine which data row rule will be used as a reference (Reference) from a group of data.
Primary is the first priority rule and Secondary is the rule that will be used if the reference selection cannot be determined by Primary.
Initial, Check If ticked, deduplication process will recreate all the object and component, not maintain the previous run result. (Initial) Initial, Uncheck If unticked, deduplication process will process new and update data and will use previous run result. (Incremental) Rule Playground Menu to perform calculation experiments that will be performed by the Rule configuration on the data being tested. Rule Template Menu to use rule recommendations for certain conditions. -
There are two types of Deduplication Rule in LinkR. To switch between two types by tick or untick the Use Rule Threshold setting.
-
Unticked Use Rule Threshold setting

-
Ticked Use Rule Threshold setting

-
-
Add Field button is to add column will be used for deduplication process for the defined rule.
-
Add Rule button will add new Rule used for deduplication. Rules give an extra check to the row data, so if the row data not found in Rule 1, it will be checked to the Rule 2, and so on.
-
Explanation for the configuration is, as bellows:
Configuration Notes Is Null Similar Configuration to set the score of null value. If null compares to null it will be decided same or different.
If ticked, so it is same. If unticked, so it is different.
Use Rule Threshold, Check If Use Rule Threshold is ticked, it will use Weight setting.
With Weight setting, all the score of deduplication column will be multiplied by weight value and sum and compared to Rule Threshold.
Use Rule Threshold, Uncheck If Use Rule Threshold is unticked, it will use Individual Threshold setting.
With Individual Threshold, the data will be considered as duplicate if all columns fulfilled the Individual Threshold of each column.
Rule Threshold The larger the threshold, the more difficult it will be to obtain matching records because the deduplication sought is more accurate/exact match. Skip If Skip setting is ticked, so the column will not be used for deduplication process but will be used when comparing the threshold or weight.
This setting also used for Source Order by column.
Destination Column Column list from input table used for deduplication process. Comparator Dropdown to set how the column data will be compared to get the score.
There are two types of comparators, WORD and FUZZY.
-
WORD: Compare the column based on words.
-
FUZZY: Compare the column based on characters, used for finding typo data.
Standardized Domain Dropdown to define the characteristic of the column, this setting will help LinkR to know the data characteristic to get better result.
Characteristic values that match these columns will increase the accuracy of the results.
There are 5 types of Standardized Domain:
-
ID_NUMBER: One word of data with long value, like Identity number or tax number.
-
ADDRESS: Data with many words.
-
NAME: Data with two to five words.
-
BIRTHDATE: Data with date format like yyyy-mm-dd.
-
POSTAL_CODE: Data with five length value.
-
EMAIL: Data with email format.
Weight This setting used when Use Rule Threshold is ticked. (It will use global Threshold).
Glossary:
-
Global Threshold: The threshold compared to total scores of the deduplication column multiplied by weight.
-
Weight: The weight of the duplicated result which will be the reference for the lower limit and the entire column being deduplicated (Can only be used when the global threshold is used).
Individual Threshold This setting used when Use Rule Threshold is unticked. Data will be treated as duplicate if all the columns have same or higher score from the Individual Threshold.
Glossary:
-
Score: Adalah nilai dari kemiripan dari data tersebut (0-1).
-
Score: Similarity value of the column (0-1)
Non Repeat If Non Repeat is ticked, there will be unique value of this column in a group of data. -
-
After finish configuring the deduplication config. Press Save button at the top right page. Saved configuration can be edited and can be copied to create new configuration.
-
-
Menjalankan Deduplication Process
Press run button in the configuration list to run the deduplication process. There will be progress bar at the configuration. After successfully finishing the process, the status will be in success status and the summary and data steward button can be clicked.
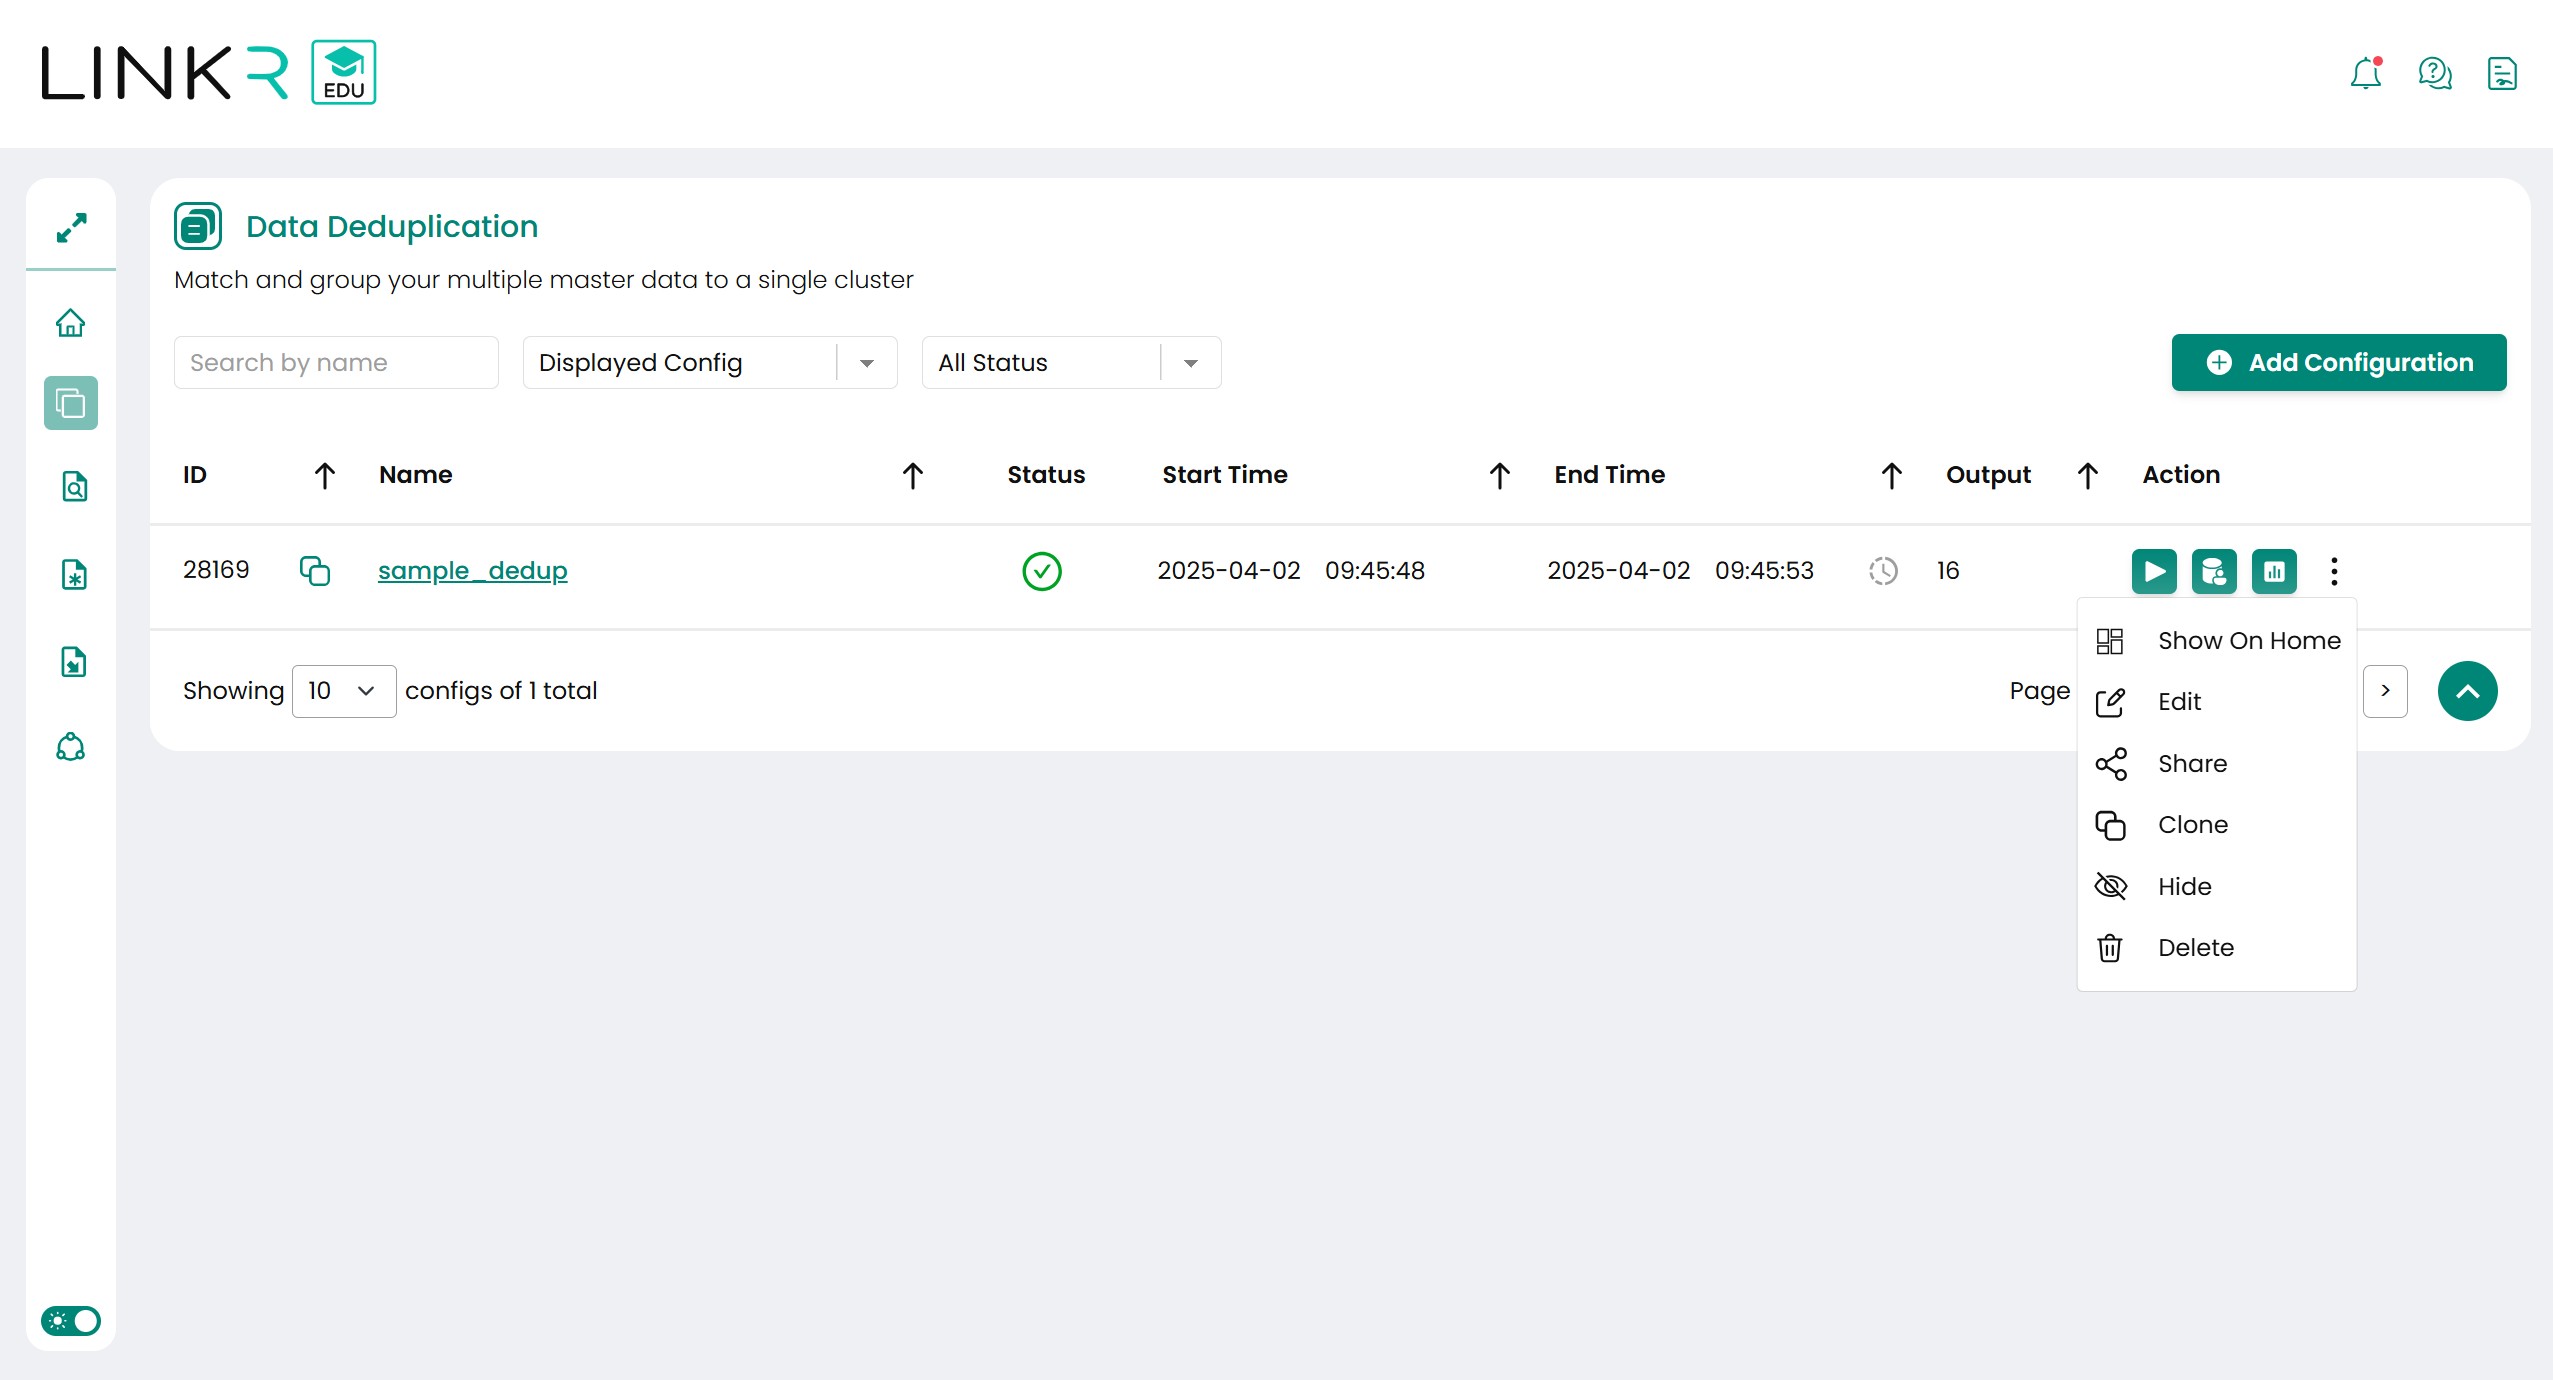
List of action button function are, as bellows:
Button Notes Run Run deduplication process based on the chosen config. Data Steward Go to Data Steward page, to browse and verify deduplication results. Summary Go to Summary page, has statistic and distribution of deduplication results. Show on Home To choose summary config which will be shown at home page. Edit Config Go to deduplication configuration page, to see or edit the configuration. Clone Create new deduplication configuration based on created configuration. Hide / Show Button to hide or show the configuration. Hidden configuration will not be shown or taken into account in home page. Delete Delete config and component related to the configuration. -
Output Deduplication Summary
After deduplication process finished, press summary button to go to summary page as bellows:
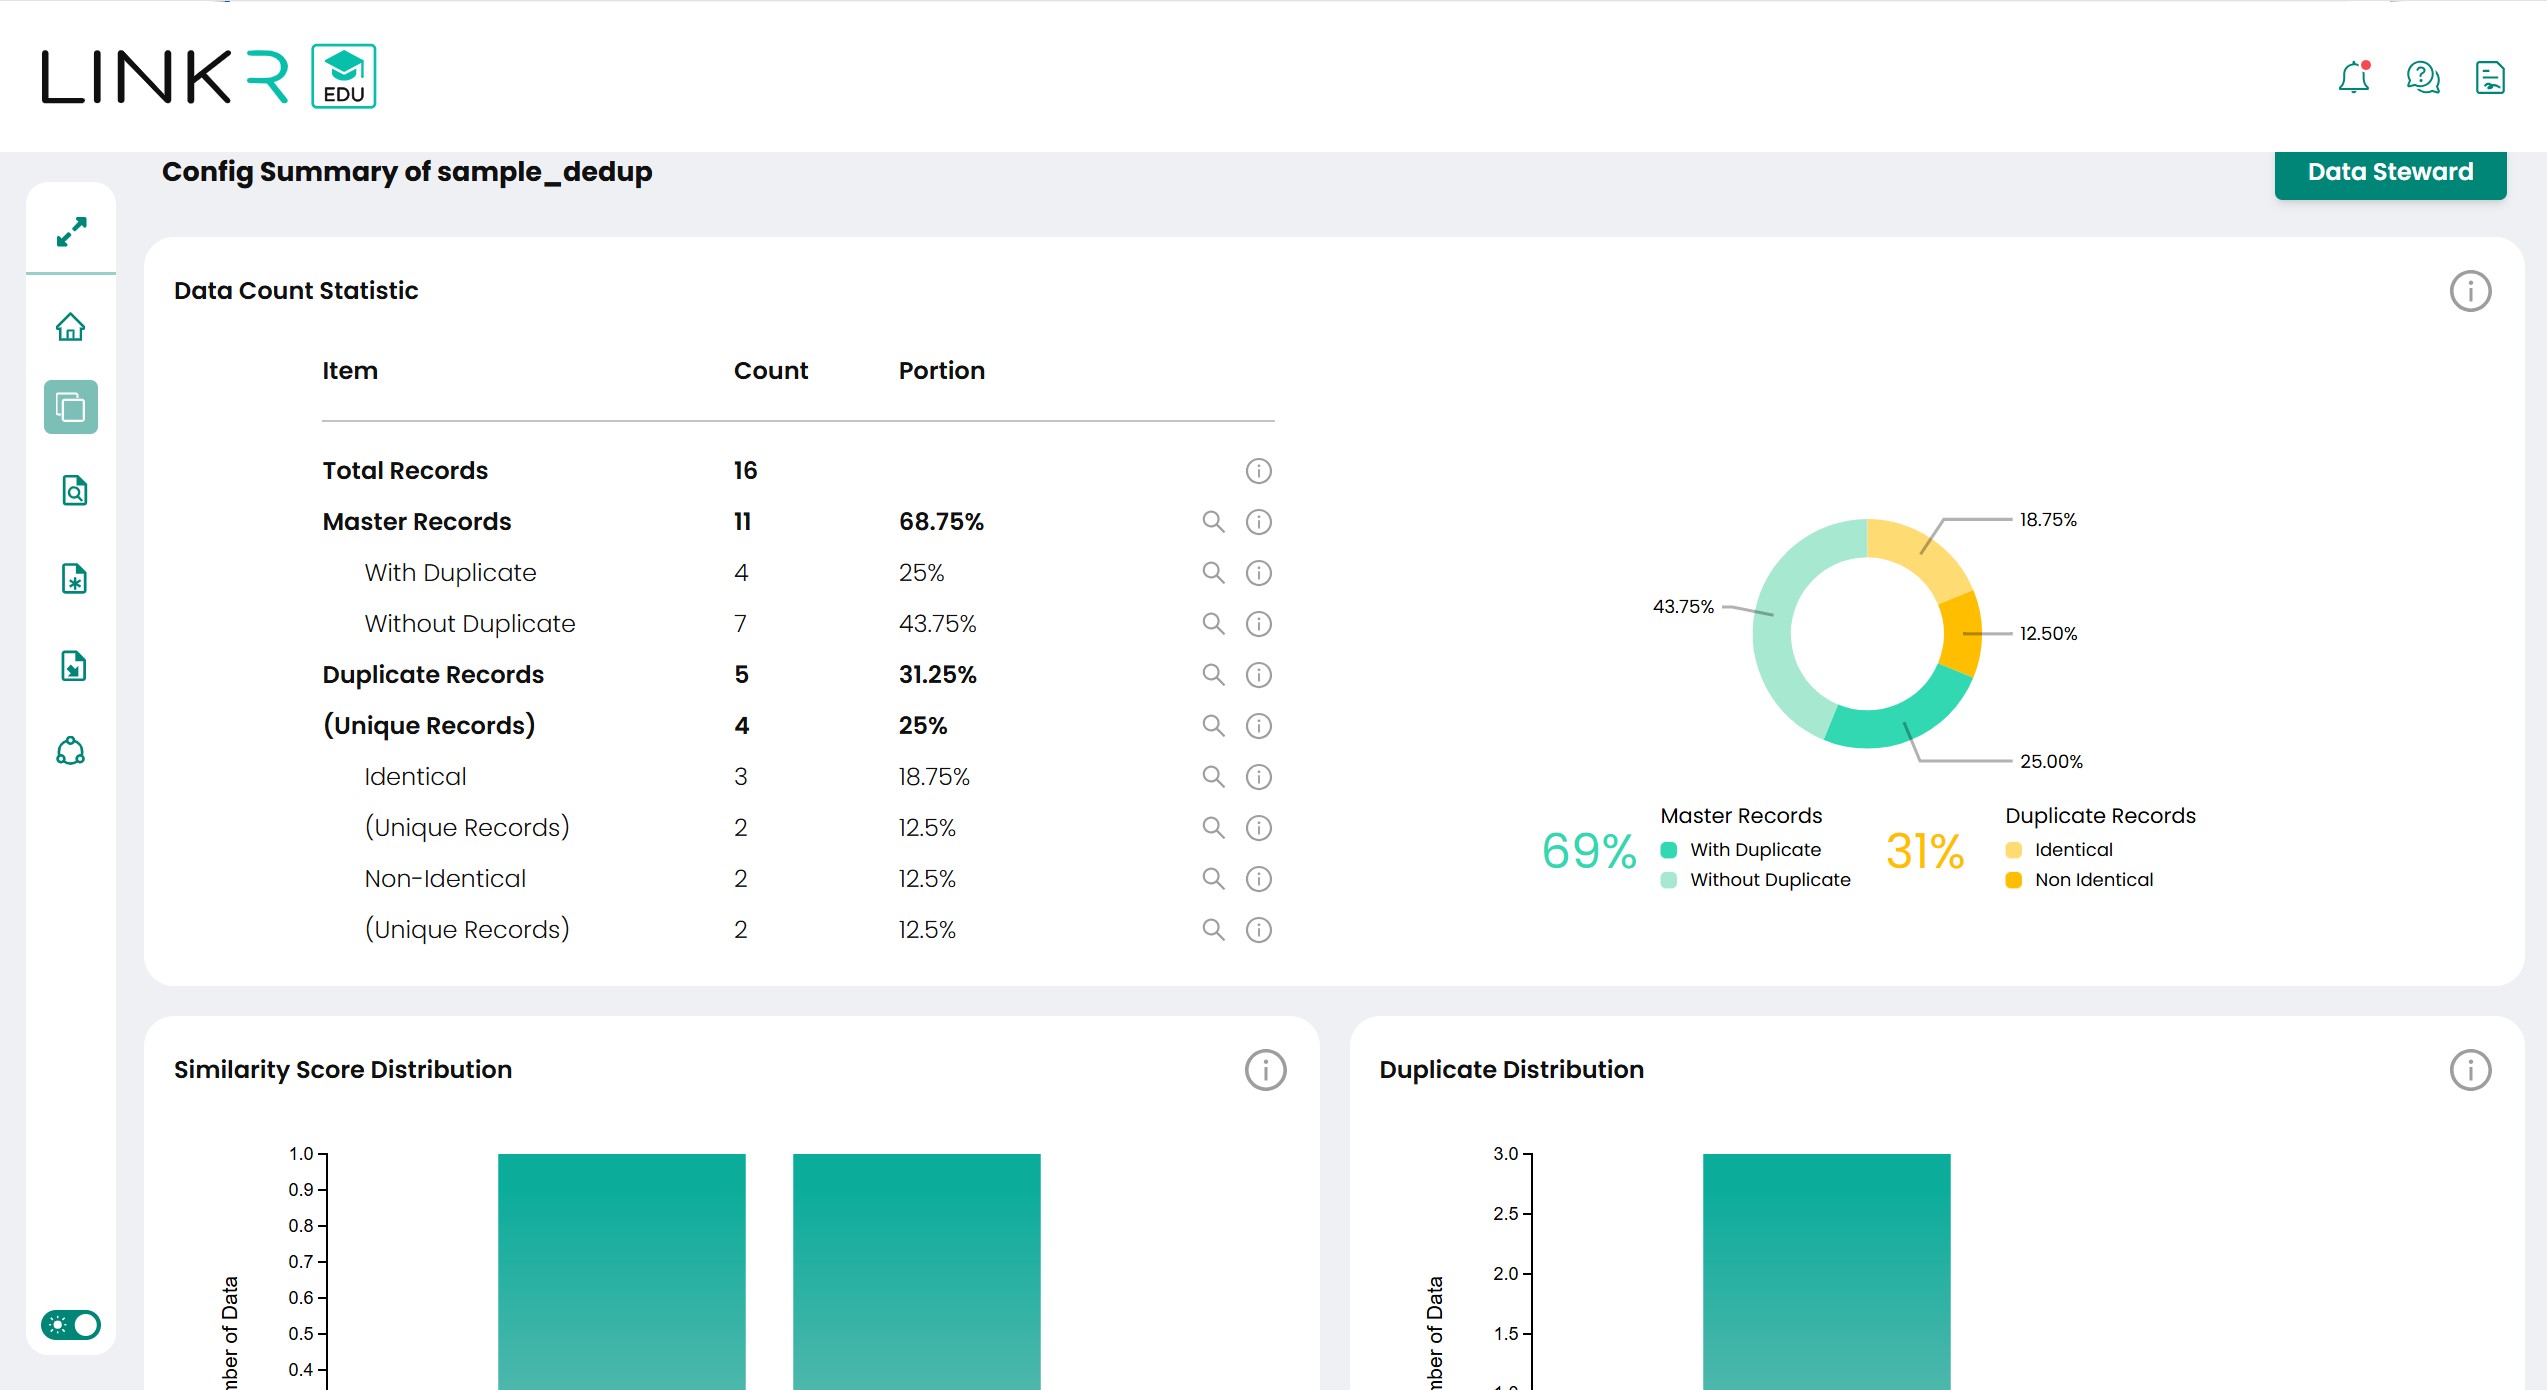
The page will show some summary of the deduplication results. The explanation regarding the summary is as follows:
Information Notes Total Records Number of all records input and processed. Master Records Count of master or golden record after deduplication process. This master record can be divided into two group, Master Records with Duplicates and Master Records without Duplicates. With Duplicates Count of master records which has duplicate data. Without Duplicates Count of master records which is the only member of the group or cluster. Duplicate Records Count of data identified as duplicate certain master data. Duplicate records divided into two groups, Identical and Non-Identical. Unique Records from Duplicate Records Number of cluster or group id in the list of duplicates records. This value will be the same as Master Records with Duplicates Identical Duplicate data with same value with the master (Exact Match). Unique Records from Identical Number of cluster or group id from list of identical duplicate data. Non-Identical Duplicate data with similar value with the master (Similar). Unique Records from Non-Identical Number of cluster or group id from list of similar duplicate data. The following is also a description of the chart in the summary display:
Chart Notes 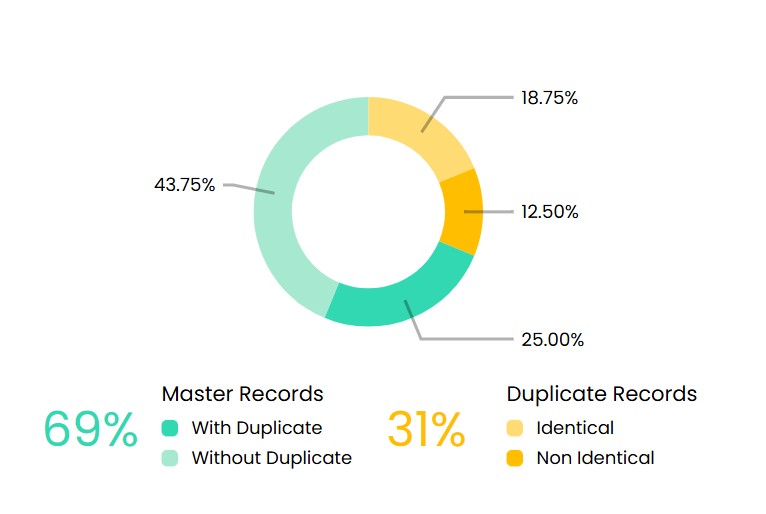
Chart view from the count statistics. 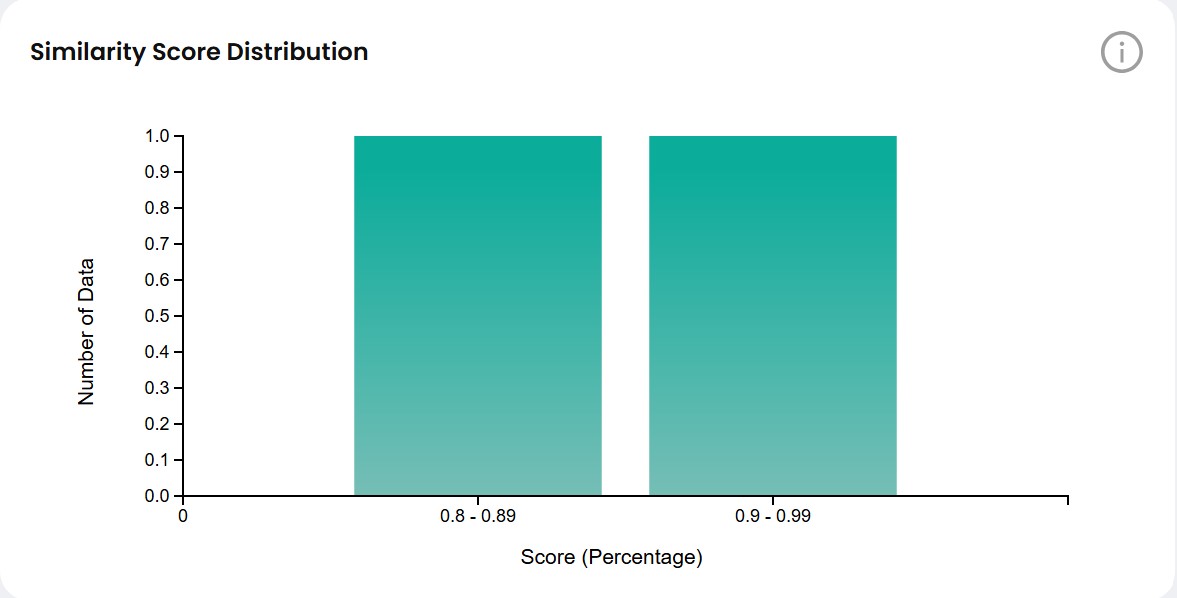
Scoring similarity frequency in bar chart view. 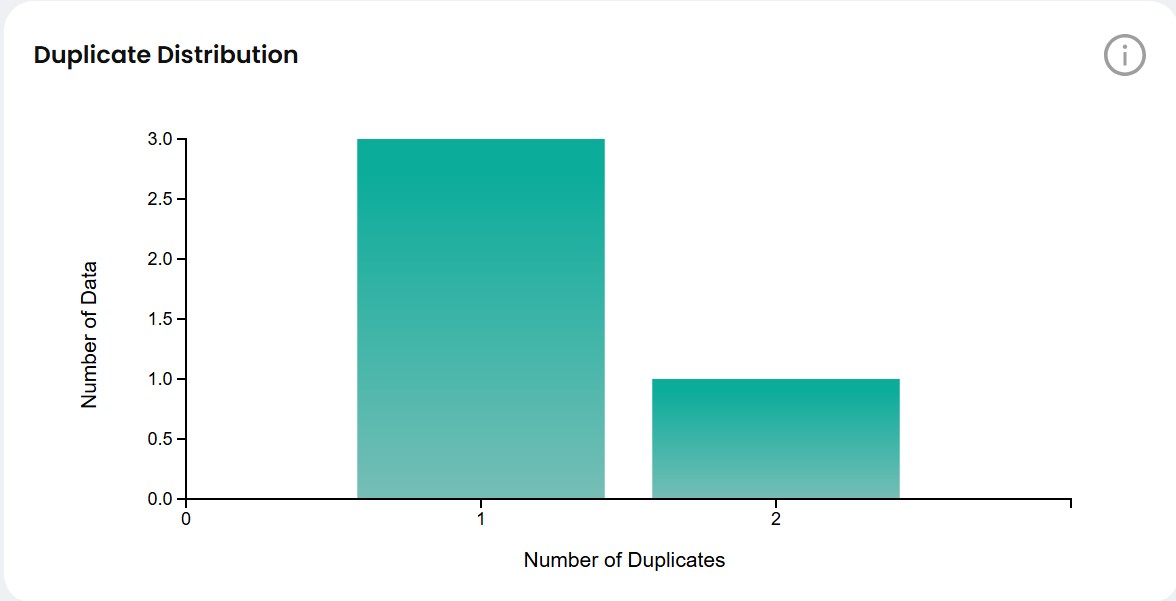
Count of master data distributed by number of duplicate data. -
Data Steward
In summary page or at deduplication configuration list, there are Data Steward button. It will redirect the user to Data Steward page. In Data Steward page, user can browse the result and do some action to change and verify the deduplication result.
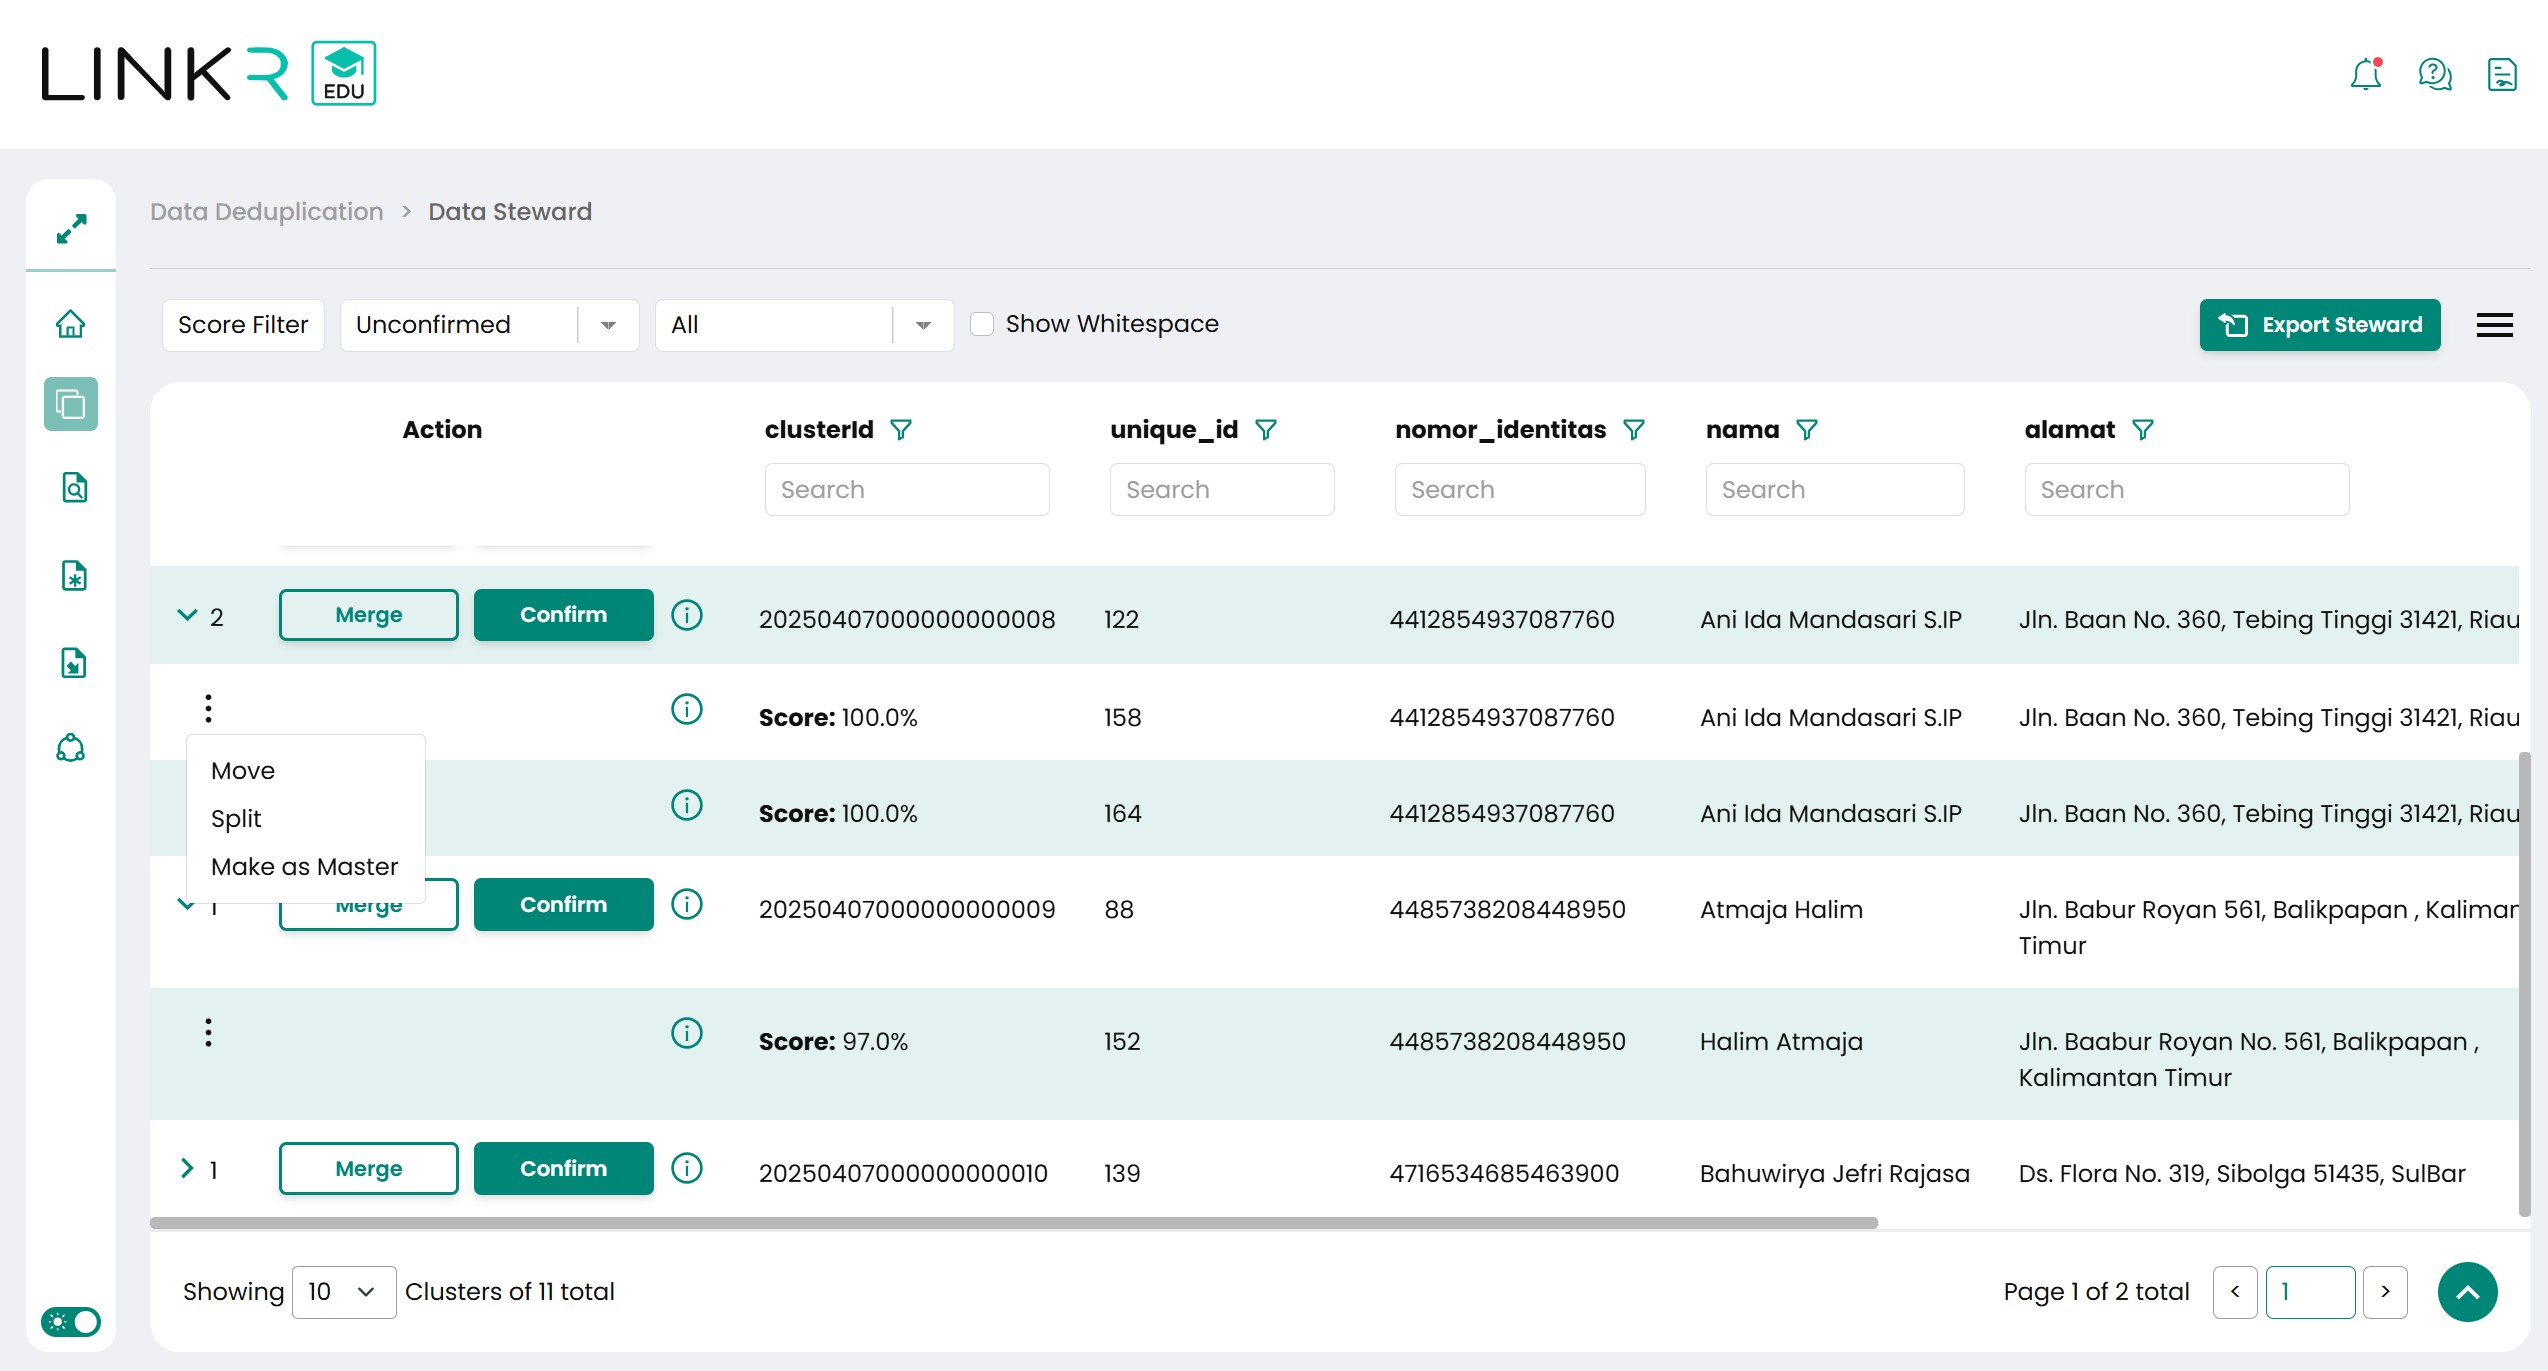
Action list can be used to change the grouping result are:
Action Notes Merge Combine a group or cluster into another cluster. Move Move row data to different cluster. Split Split row data to new cluster. Make as Master To change the selected row data in a certain cluster from duplicate status to master. Confirm / Unconfirm Change the flag of cluster, is it verified or not. Data Steward activity will be recorded and can be browsed in Audit Trail page. Audit Trail page can be accessed by pressing the History button at top right menu. There are several functions at top right menu, the description as bellows:
Menu Notes Export Steward Export deduplicated data into a tabular excel file. Setting Table Configuration to change the column list displayed on the data steward or change the column name to something else on the display. History Redirected to Audit Trail Data Steward page. Collapse All Close all cluster shown in the data steward. Expand All Open all cluster shown in the data steward. There are several dropdowns on top of data steward table. The dropdown will affect which data will be shown in the data steward table.
Filter Notes Score Filter Filter to get the group data base on duplicate total score. Unconfirmed, Confirmed, All Get group data based on verified status. All, have duplicates, unique To get group data based on numbers of data in a group or cluster. This dropdown will change the search box behaviour:
-
All: Search box will do the searching in master and duplicate row data.
-
Have Duplicates: Search box will do the searching in duplicate row data only.
-
Unique: Search box Search box will do the searching in duplicate row data only.
Search box in Data Steward has two behaviours:
-
Data String or Character, search based on part of the value.
-
Data Integer or Number, search based on full value.
-
-
-

